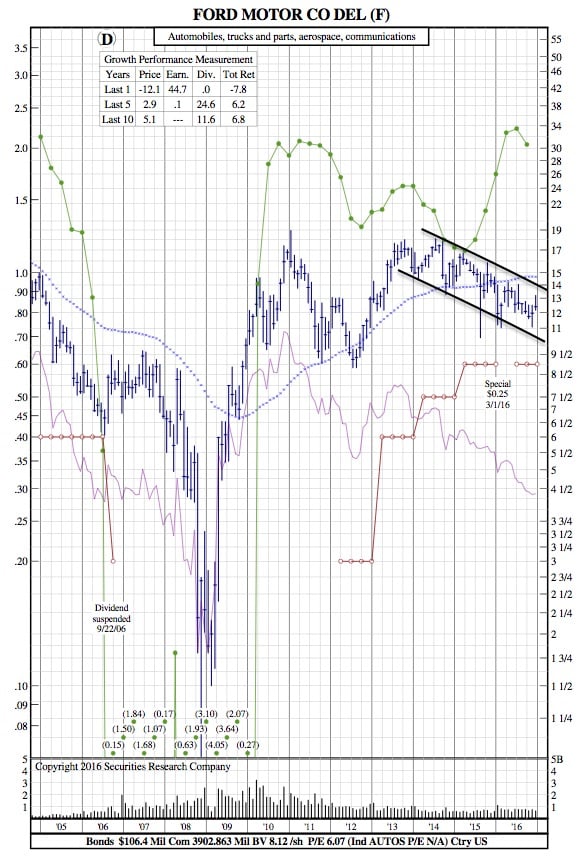
A Look at Ford’s 12-Year Chart after a Lackluster 2016
 24/7 Wall St. — As the stock market inches toward the end of the year, among the four car manufacturers that sell the most cars in the United States, there is one clear loser in the stock market. Ford Motor Co. (NYSE:F) shares are down sharply, off 12%.
Wall Street has not been kind to the auto industry in general during 2016. While the S&P 500 is up 10%, General Motors Co. (GM) stock is higher by 3% and Fiat Chrysler Automobiles Inc. (FCAU) and Toyota Motor Corp. (TM) are off by 3% each.
What do investors dislike when they look at Ford? First, Ford is relatively small in China, the world’s largest car market. In November, it sold 124,113 vehicles among its various local partnerships and cars it imported. Changan Ford, the largest venture, accounted for three-quarters of the sales. GM sold 371,740 cars in the same month. Volkswagen sold 294,147. China’s market is growing so quickly that the leaders in the country have an edge in terms of overall future global revenue growth and revenue size.
Ford is also small in Europe. In the 20 countries generally used to define the region, Ford’s sales were 104,700, in a market that produced 1,363,400. By contrast, Volkswagen has roughly a quarter of the market. PSA Group, maker of Peugeot, has over 10% of the market.
In the United States, the overall market is barely growing, and Ford’s approximately 14% share of the 1,380,588 total American sales count puts it in a battle with GM at just over 18%, Toyota at the same level as Ford and Fiat Chrysler at just over 11%.
All the world’s largest car companies are under pressure, as it appears the U.S. market has peaked. The disadvantage Ford has is that it is not a dominant force in the two other large markets.
Ford 12-Year Chart:
While Ford’s price is down 12% on the year, there still lies the possibility for upside potential based on strong earnings, which are up nearly 45% on the year.