Technical Analysis
Technical Analysis
You will find explanations and illustrations of formations and technical price indicators only like support levels, resistance levels, channels using SRC’s short-term stock charts.
Technical Analysis: Support Level
Sometimes a chart looks like the price is rising as if there was a floor beneath them. Usually this indicates that many people in the market firmly believe that the stock is intrinsically “worth it” based perhaps on a previous low, or on the company’s book value.
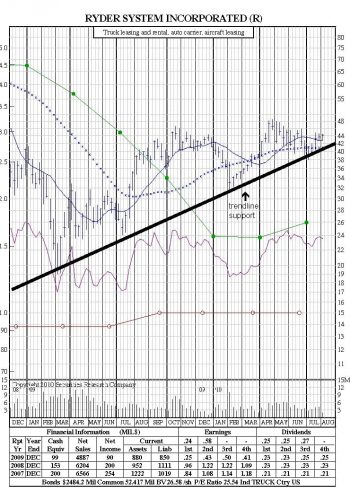
In the chart below, Ryder continues to trade above trendline support. Each successful test of the trendline demonstrates that the long-term upward trend is intact. A break below trendline support would be a sign of weakness and potentially signal a trend reversal.
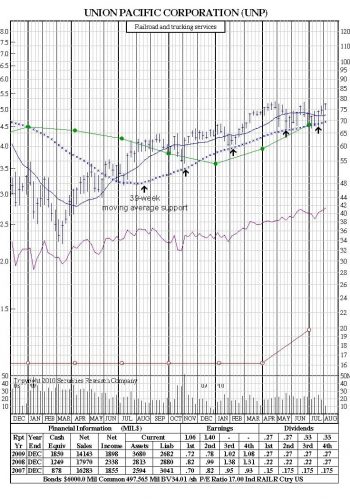
In the chart below, the 39-week moving average has provided dependable support for UNP, with numerous successful tests since July ‘09. The stock continues to rally after pullbacks to the moving average, whereas a break below it could suggest a trend reversal.
Technical Analysis: Resistance Level
Resistance Levels are ceilings, which are just like floors – but in reverse. The price of a certain stock may come up to – but will not exceed the resistance level. This level may be arbitrary, or it may have been set by the collective calculations of many investors on the basis of P/E ratio or previous highs.
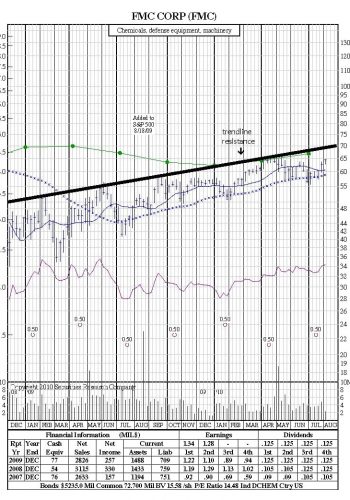
In the chart below, FMC appears to be trading below trendline resistance originating in Feb ‘09 and currently at $70. Another failure to break above the trendline would suggest another pullback or more sideways action, whereas a break above the trendline would be a bullish event.
Technical Analysis: Channels
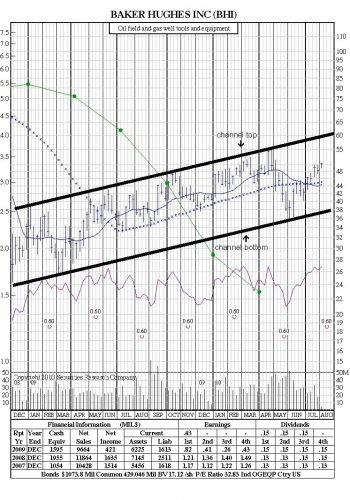
If a stock’s price fluctuates around a common line, a channel formation exists. A channel is defined by drawing one line connecting all the recent tops and another connecting all recent bottoms, usually in a diagonal pattern. Characteristically, a stock will continue to fluctuate within the channel lines. There are up and down channels, as well as channels inside a longer channel. Technical theory says that if the stock’s price breaks out of the channel, it will continue in the direction of the breakout, rather than continuing to fluctuate.
In the chart below, Baker Hughes appears to be trading within an upward-sloping trading channel. Additionally, the 39-week moving average also appears to be providing support and resistance within the channel, dictating bounces back to the channel top (July, Sept, Dec ‘09) or breaks to channel bottom (May ‘10). The July ’10 break above 39-week moving average suggests a move to the channel top at $60 (and rising.)
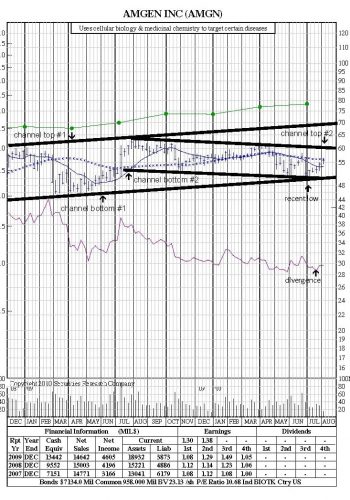
In the chart below, AMGN appears to be trading within two trading channels: a long-term ascending channel and a shorter-term descending channel. It tested and held at both long-term and short-term channel bottom support at $49 and appears aimed for a test of its shorter-term channel top resistance at $60. A break above $60 clears the way for a move to $70, while a failed test suggests a pullback, possibly to form the right shoulder of an inverse head & shoulders similar to 12 months ago. Additionally, AMGN’s relative performance line is showing strength compared to the general market, as its recent low in price did not produce a low in the performance line – a bullish divergence.
