
ChartScreen. SRC’s Online Research.
SRC’s online service is relied upon by investors for its comprehensive research and filtering capabilities, including the breadth and depth of historical stock data and its crystal clear, full-color presentation. ChartScreen is SRC’s comprehensive online service providing access to nearly 4,500 companies traded on the NYSE, AMEX and NASDAQ, featuring SRC’s Daily through 50-Year time periods.
Four Options Available:
Key fundamental equity data every investor needs
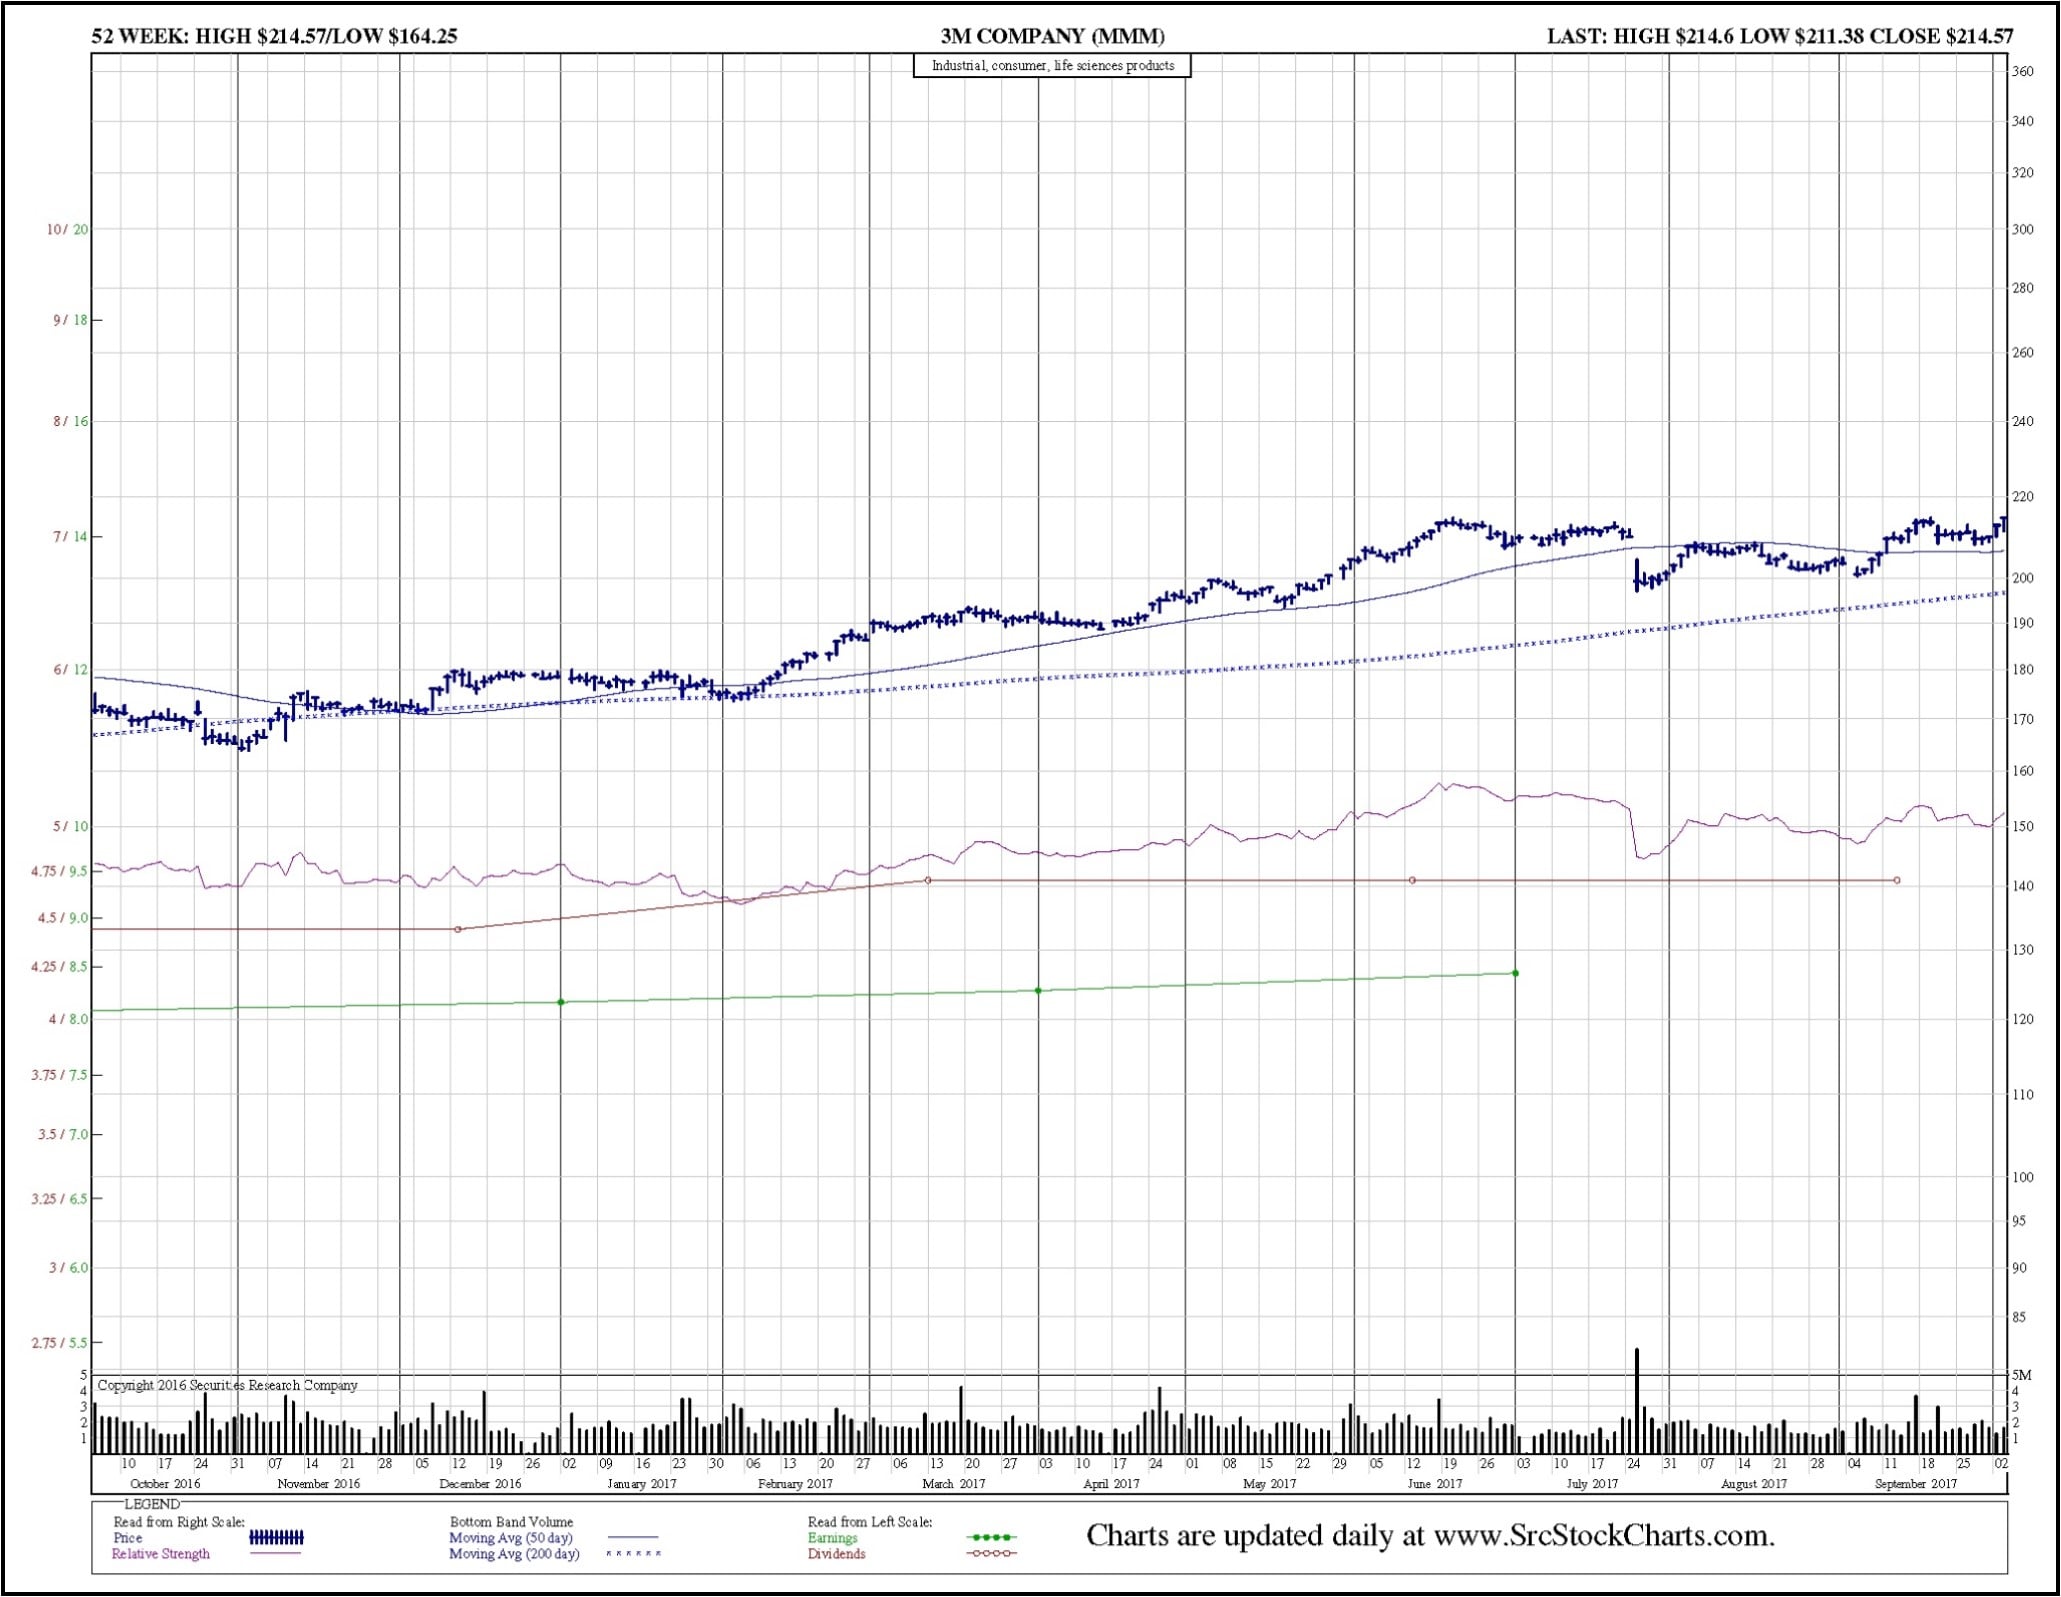
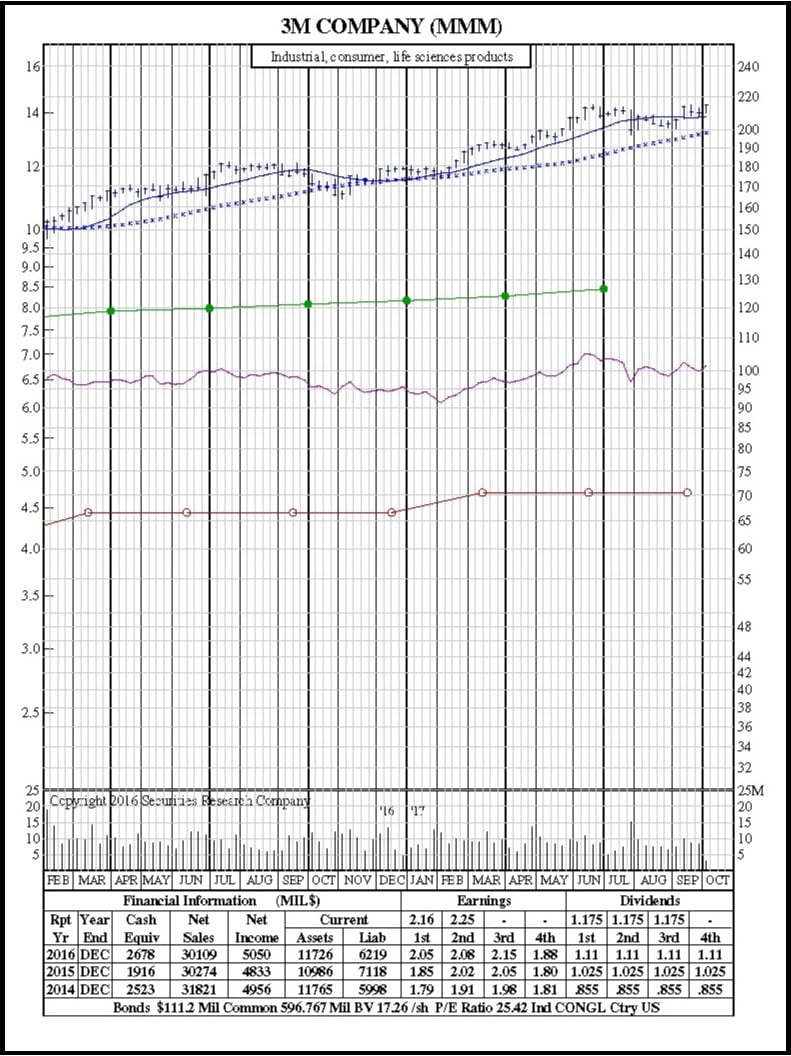
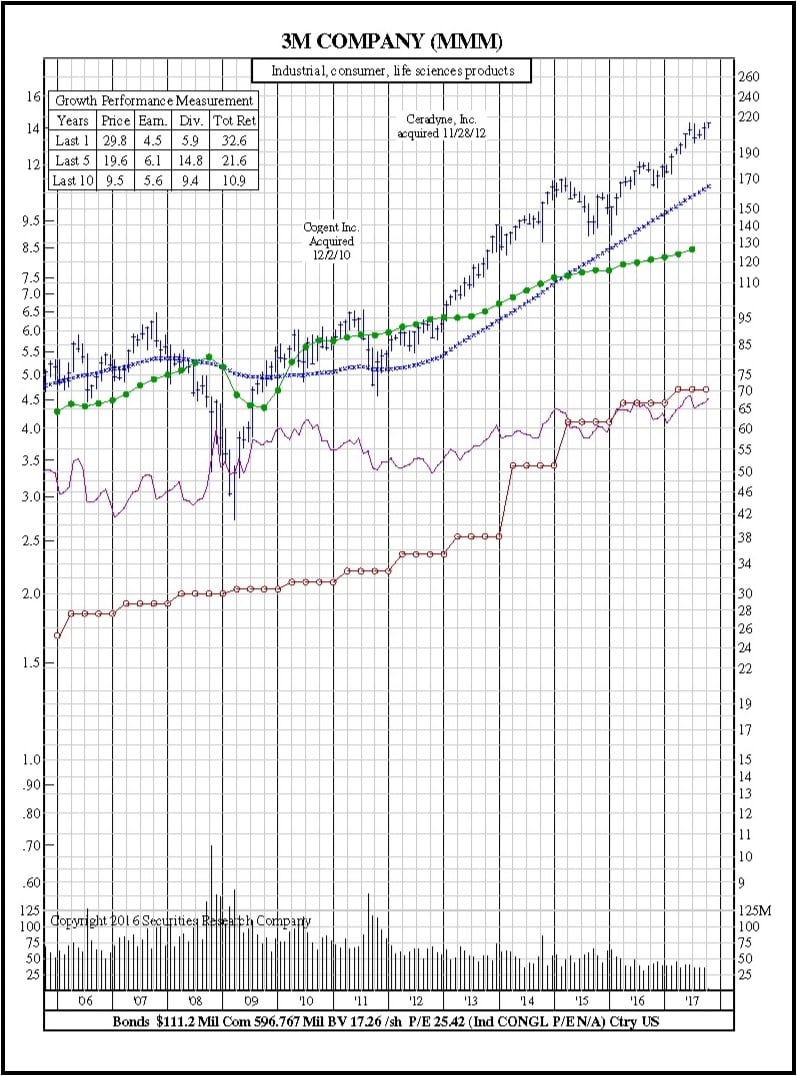
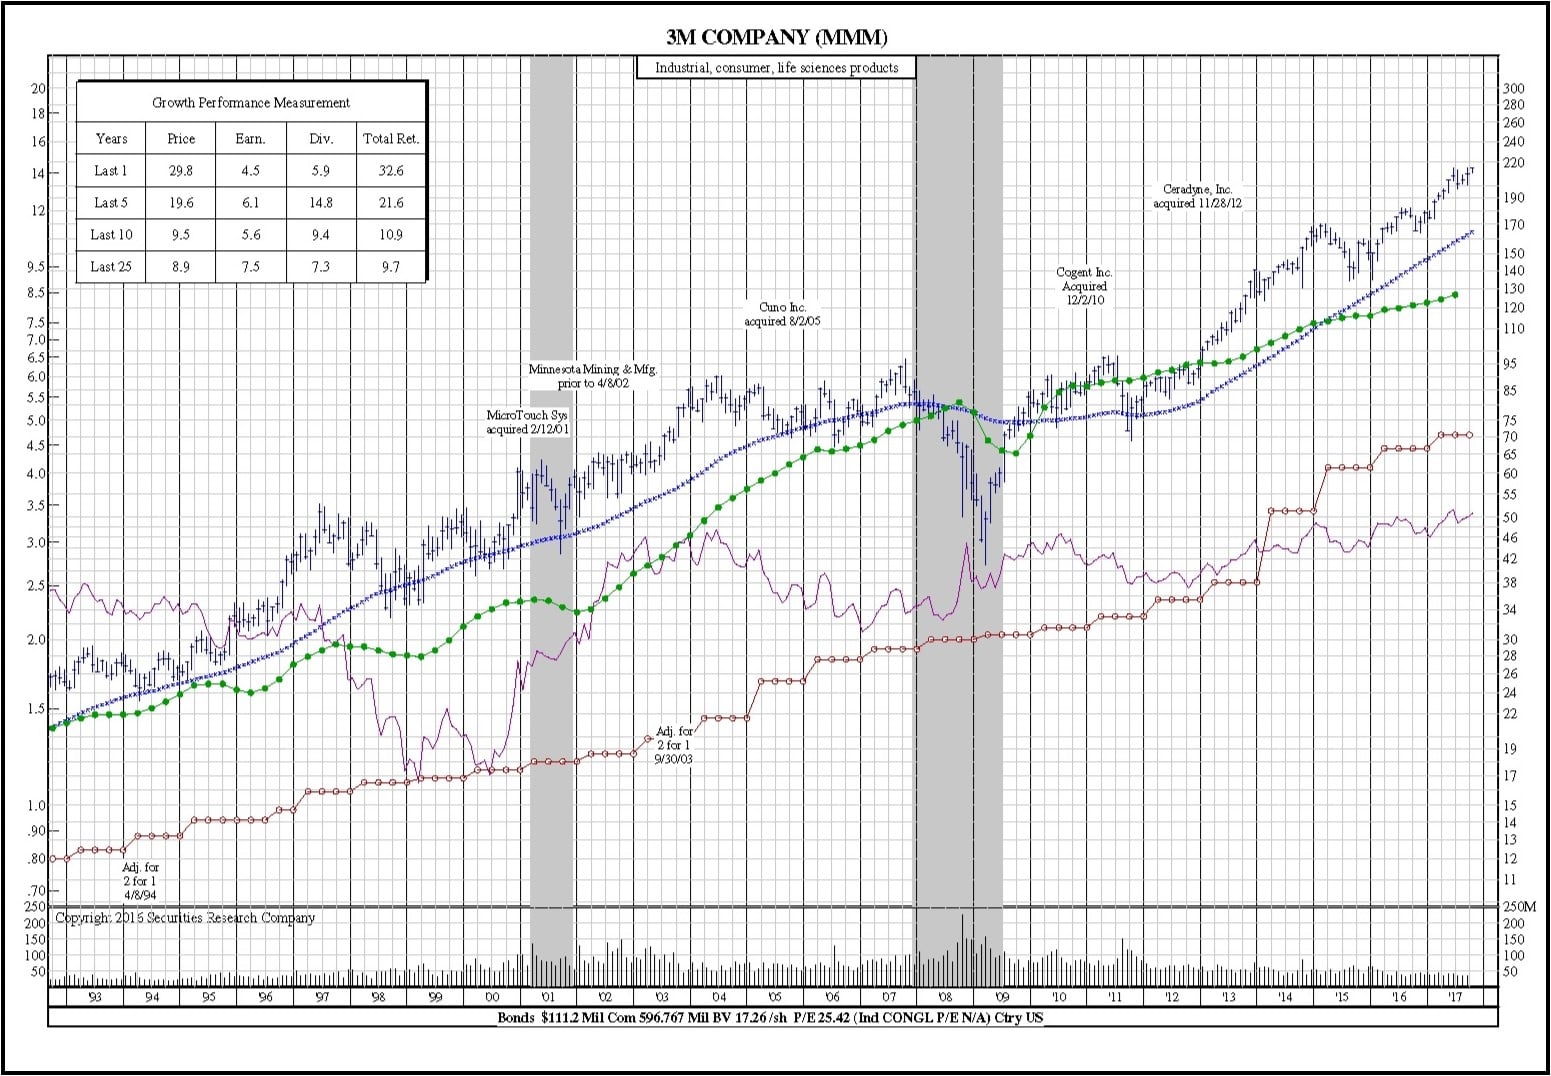
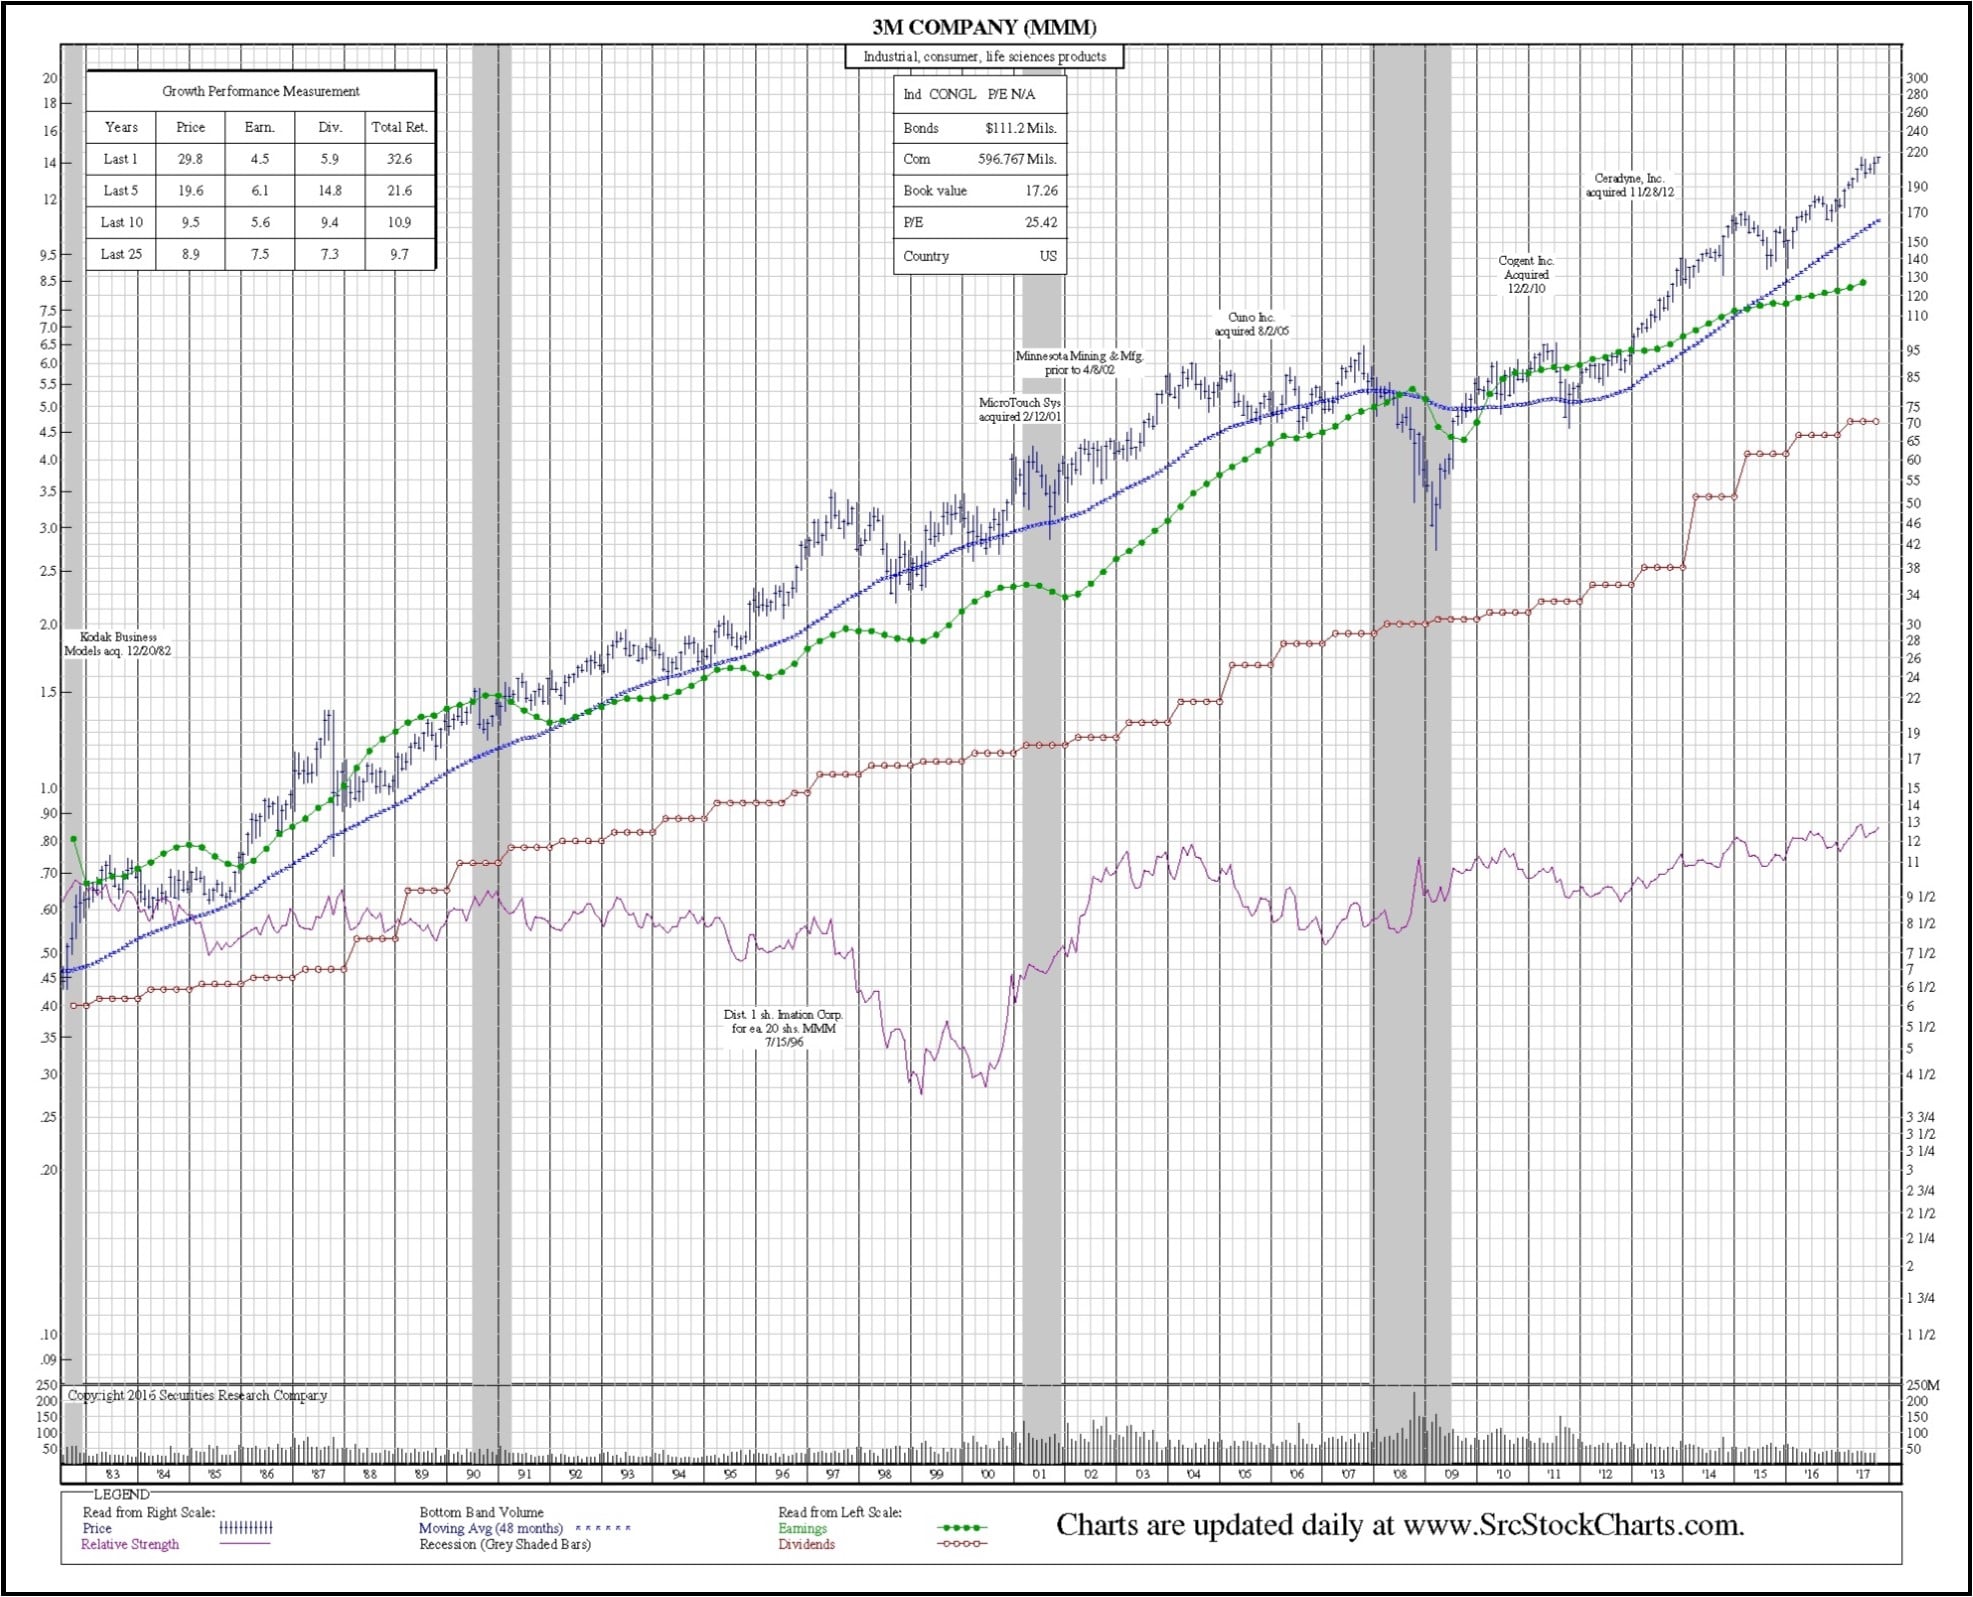
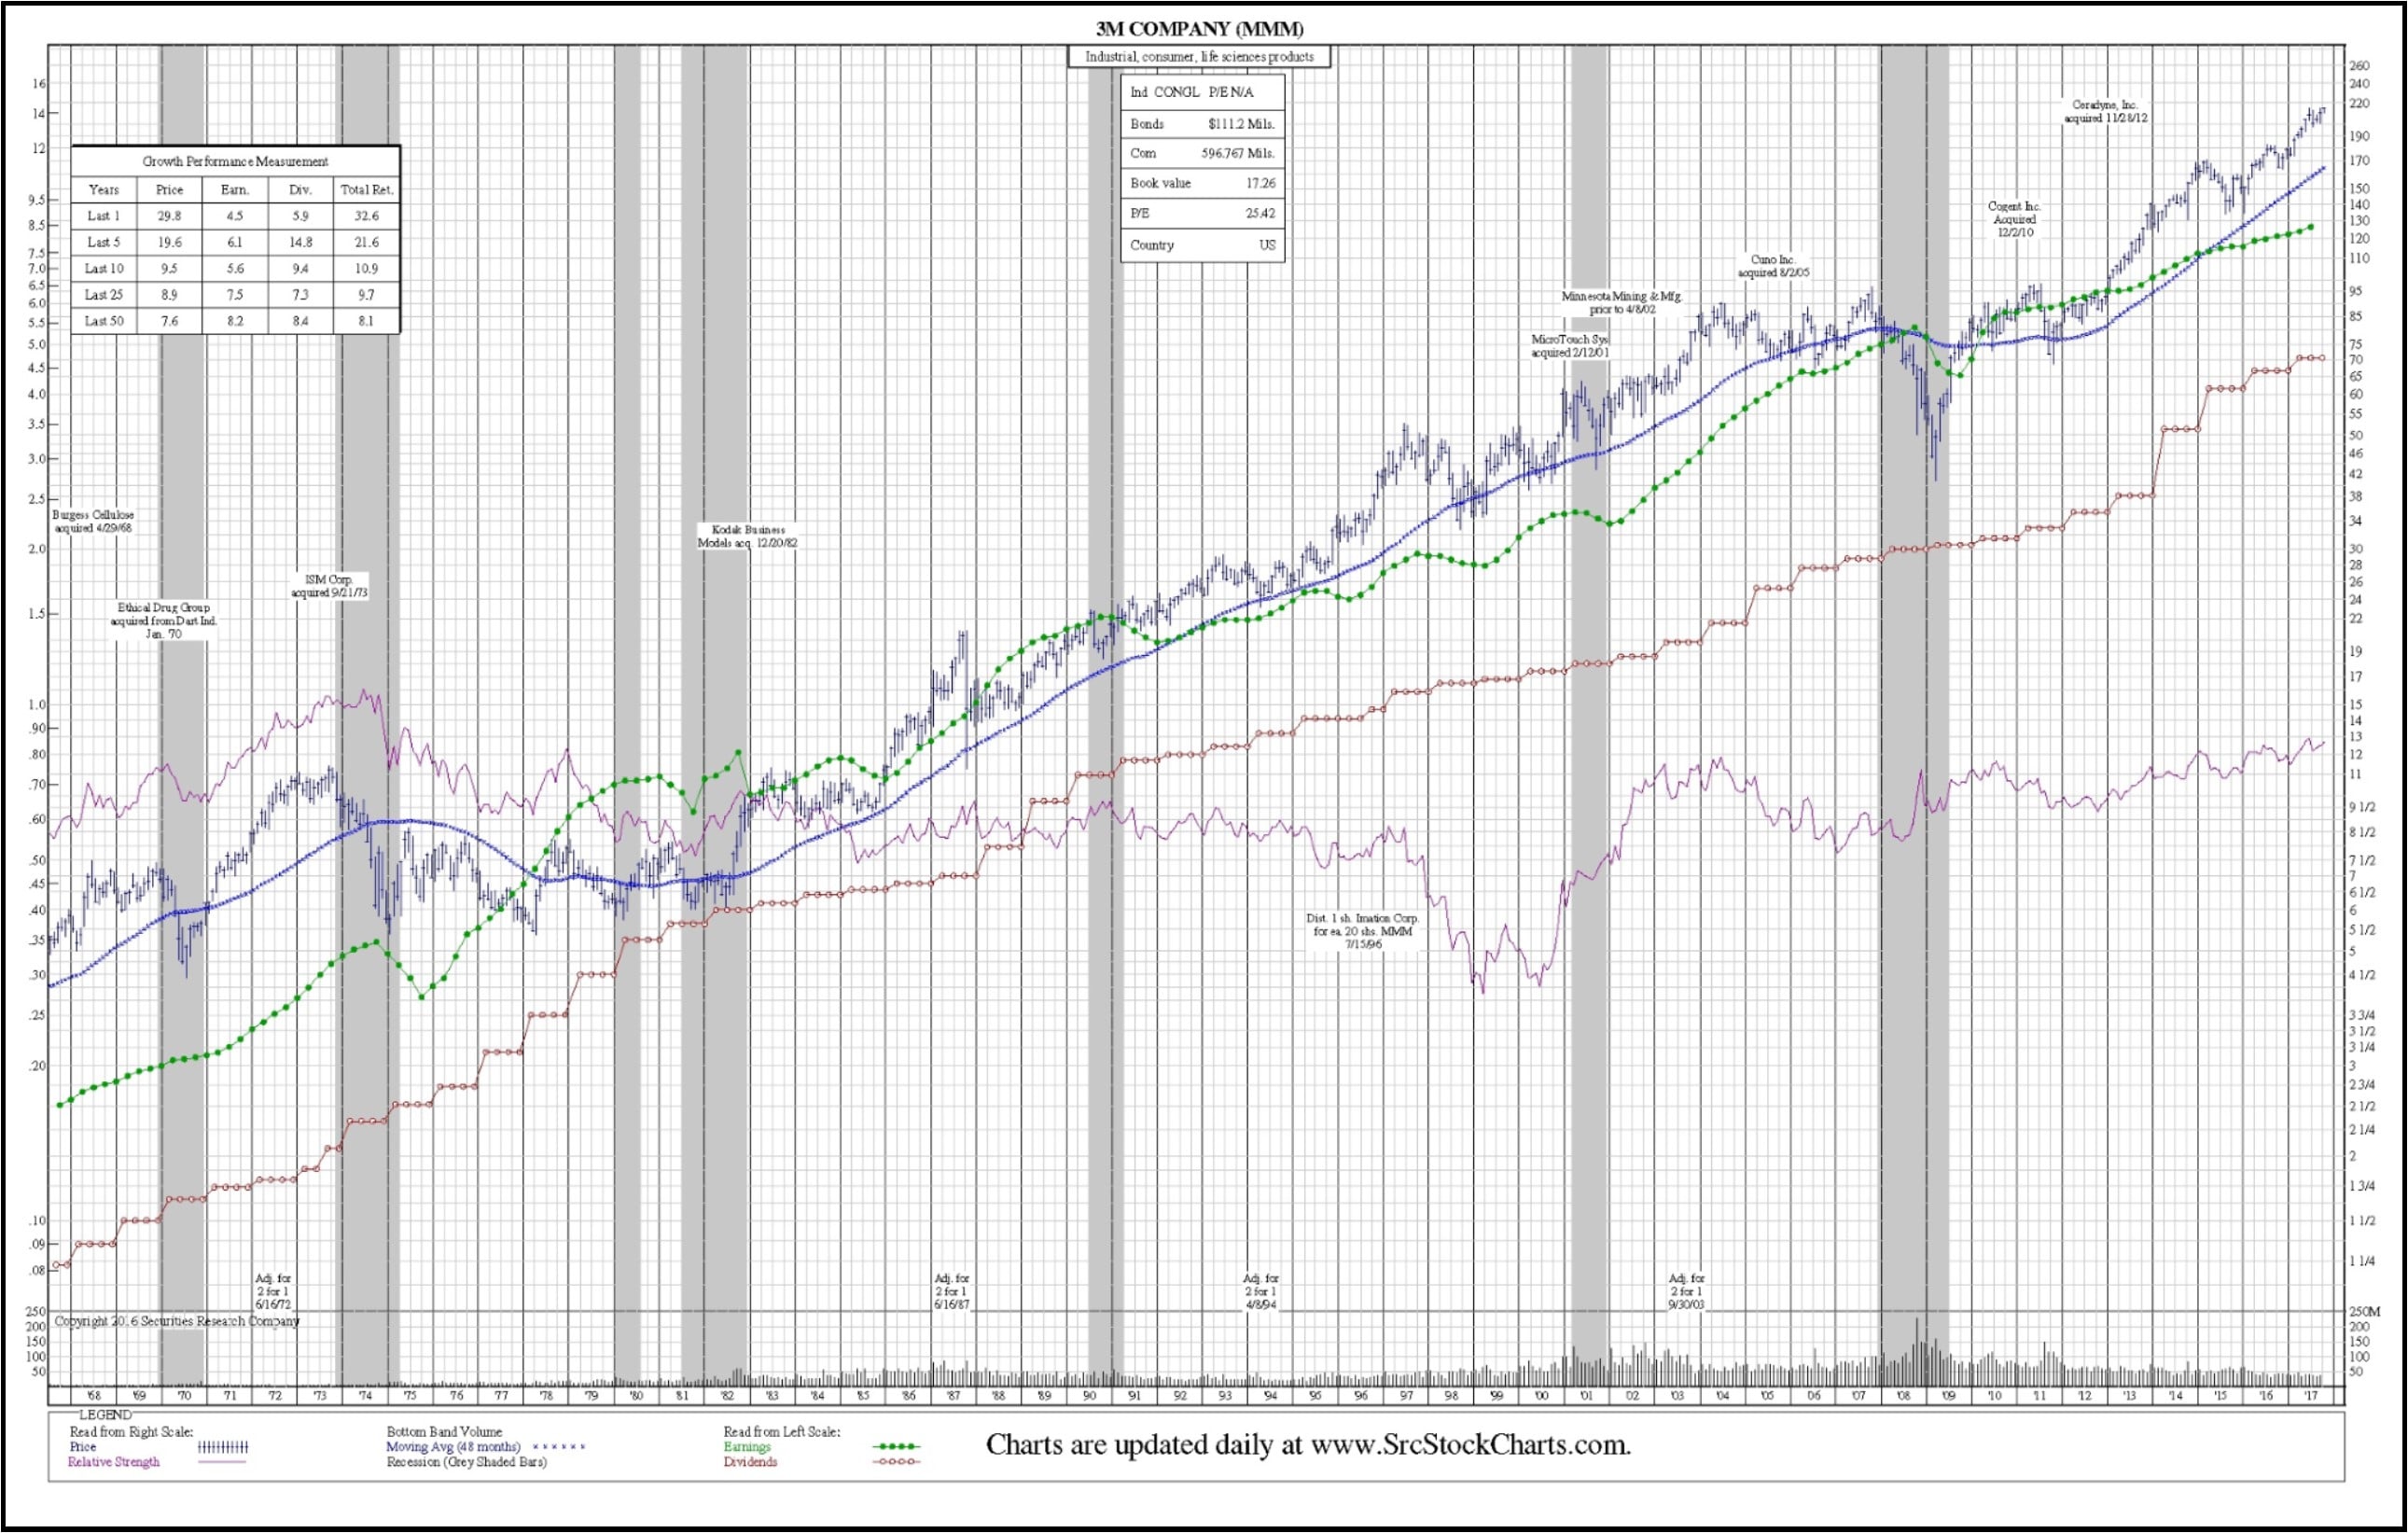
SRC has a one of kind, comprehensive database of stock fundamentals going back to its inception in 1933. Each SRC Equity Chart graphically traces the monthly price ranges, relative-to-market performance, moving average, trading volumes, plus earnings adjusted for extraordinary items, dividends. In addition all data has been fully adjusted for stock splits and dividends. Key events in the company’s history are also noted. You can also create up to 25 portfolios. Each online equity chart is updated nightly, full-color and presentation-quality!
Screens & filters to help you find the right stocks fast.
With ChartScreen, all charts are updated each day, plus you can use SRC’s powerful search & filtering functions to help you quickly find the stocks that fit your investing criteria. Filters include: Exchanges • Industries • Sectors • P/E Ratio • P/G Ratio • PEG/PEGY Ratio • Price Growth • Dividend Yield • Earnings Growth • New 52 Week Close (High/Low) • Volume (20 day average) • Earnings Stability (R2) • Revenue Growth, and Market Capitalization.


