Earnings Per Share
Earnings per share (EPS) is one of the most important fundamental factors when selecting a stock.
Different types of companies have different earnings per share tendencies, and to gain an understanding of how earnings per share differ, let’s take a brief look at the different company types to get started:
- Initial Public Offerings (IPOs) – these early stage companies are often not producing earnings in their early growth stage as cash is re-invested into the company for product development, sales and building operations. These companies may not have earnings for some time until the operation becomes profitable.
- Growth Stocks – there are generally two types of growth companies. The first is a company that is considered no longer and “IPO” but has been publicly traded for for a few to many years. These companies are generally plowing all earnings back into business operations to accelerate growth. The second is a growth stock that is producing earnings and it’s the earnings growth rate that often influence the current stock price and projected earnings per share for future quarters that is often responsible for a company’s price changes or fluctuations.
- Dividend or Income Stocks – are generally well-established companies (often companies that are part of the S&P 500) or DJIA that have consistent earnings growth.
- Value Stocks – are companies that have earnings or a price/earnings ratio (P/E) ratio which is lower than other companies in their industry. These companies may simply not be in a popular or heavily-traded industry, and may fall in or out fashion.
- Cyclical Stocks – are companies that are heavily influenced by the overall US economy and have earnings fluctuate based on revenue. Common industries that have stocks of a cyclical nature are airlines, hotels, entertainment, retail among others.
We will look at examples of earnings per share patterns of companies in these categories using Securities Research Company’s 12-Year stockcharts.
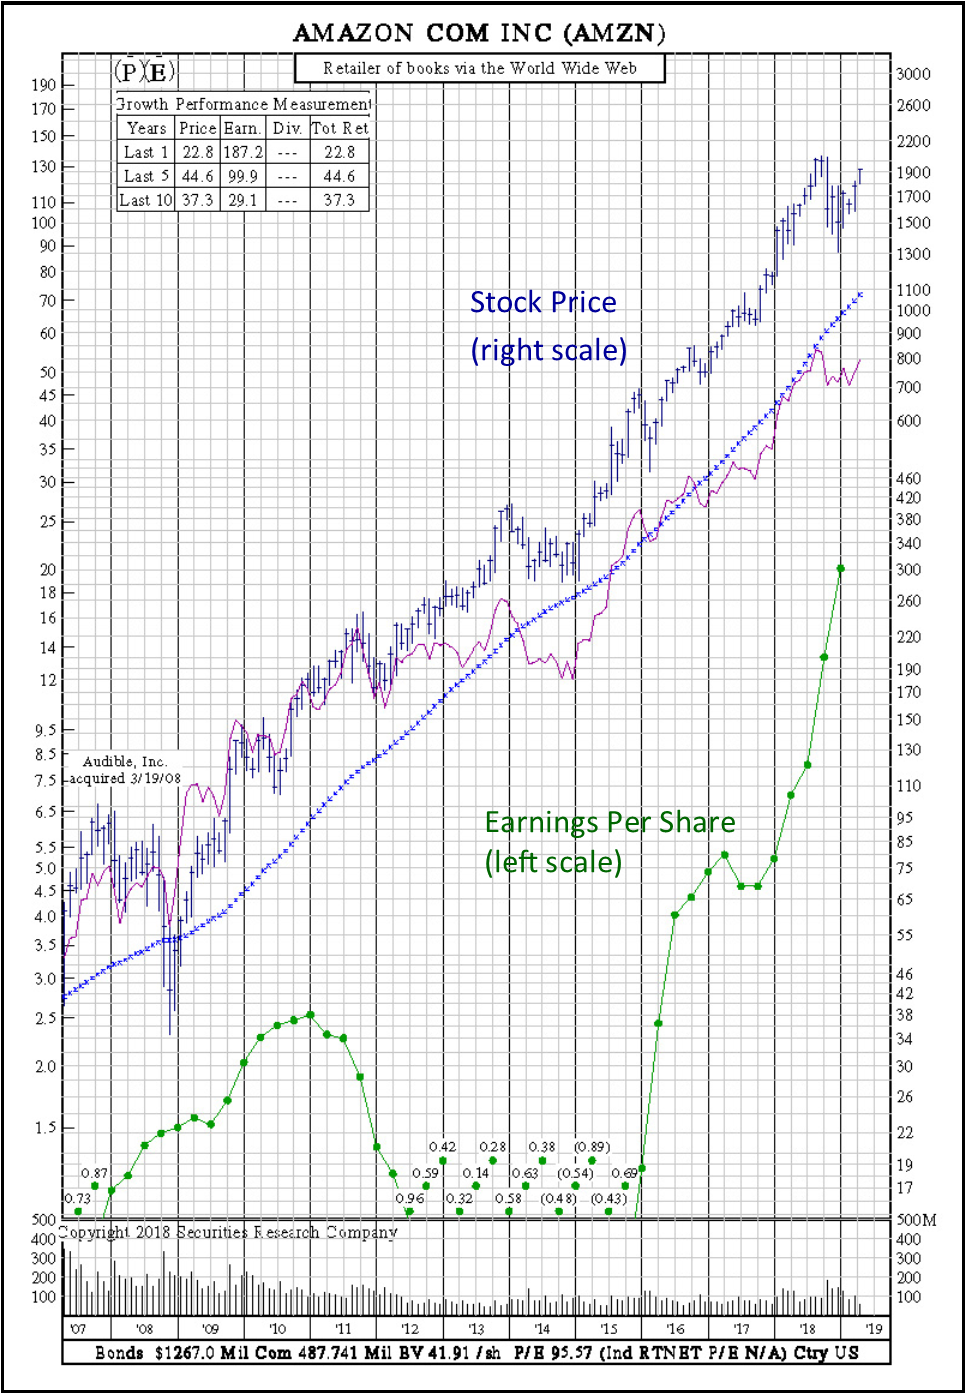
Earnings Per Share: Growth Stock. Below is an example of earnings per share for the Amazon growth stock. Note both the earnings and price increase over time, with a dip in earnings during a period of high investment in operations for Amazon.

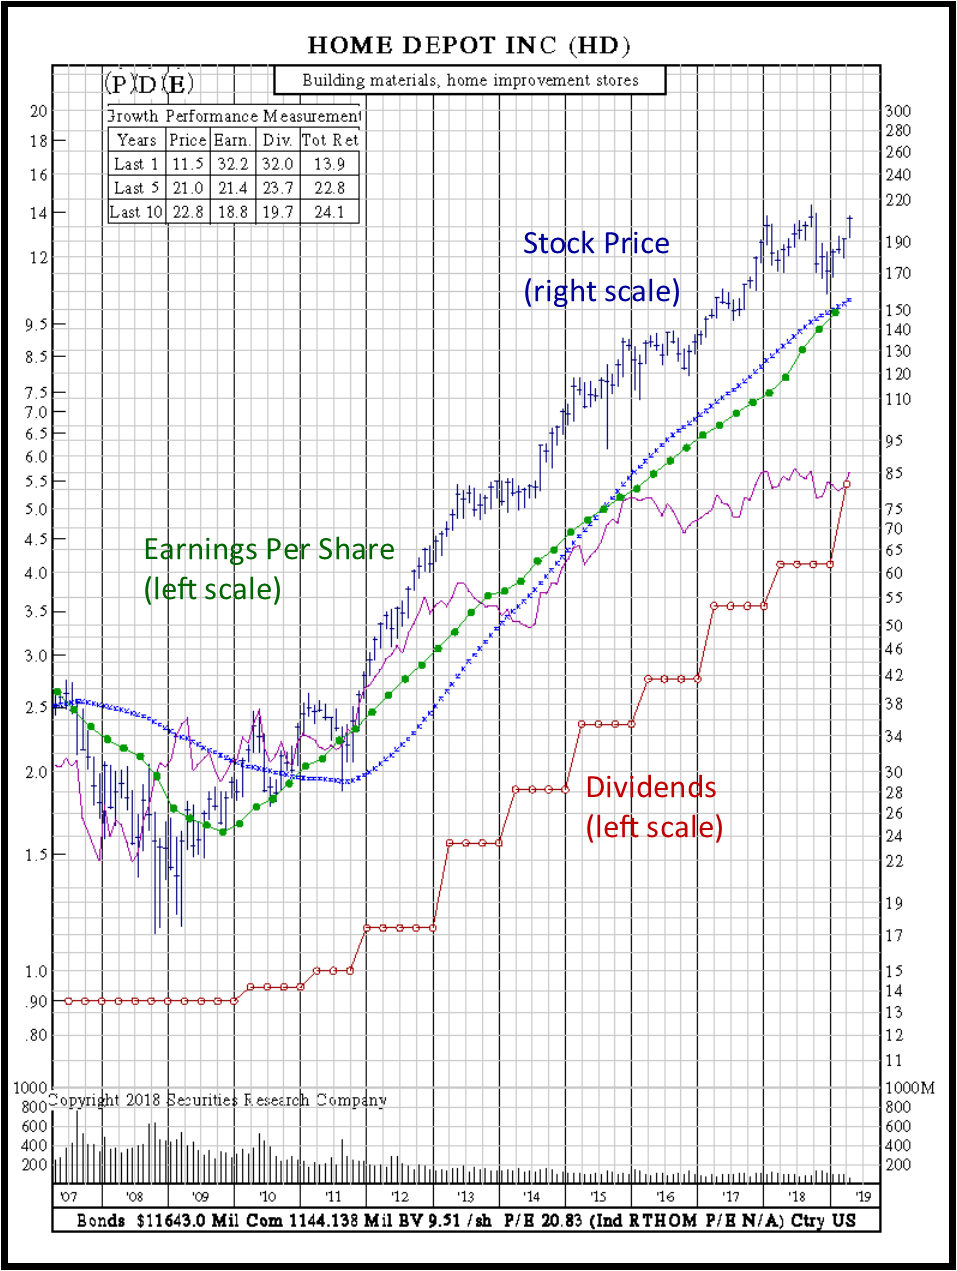
Earnings Per Share: Dividend Stock. Below is an example of earnings per share for the Home Depot dividend stock. Note all three fundamentals, dividends, price and earnings and price increase over time.

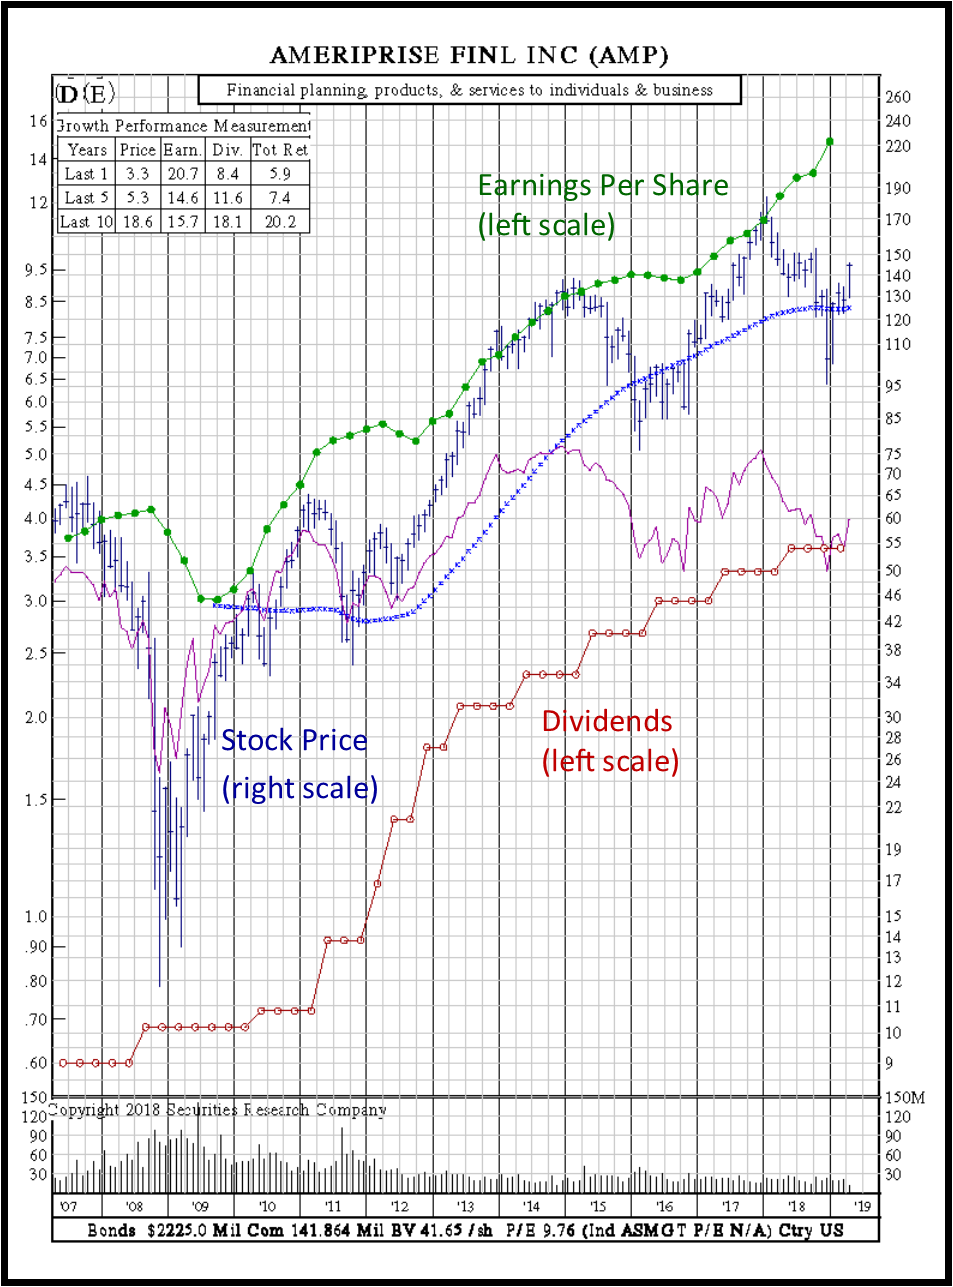
Earnings Per Share: Value Stock. Below is an example of earnings per share for the Ameriprise stock. Note that this stock is trading below a P/E ratio of 15:1, and the divergence of higher earnings than price as displayed on the chart. As with all value stocks, more research to the company will provide greater insight as to whether this would be a good value stock to invest in.

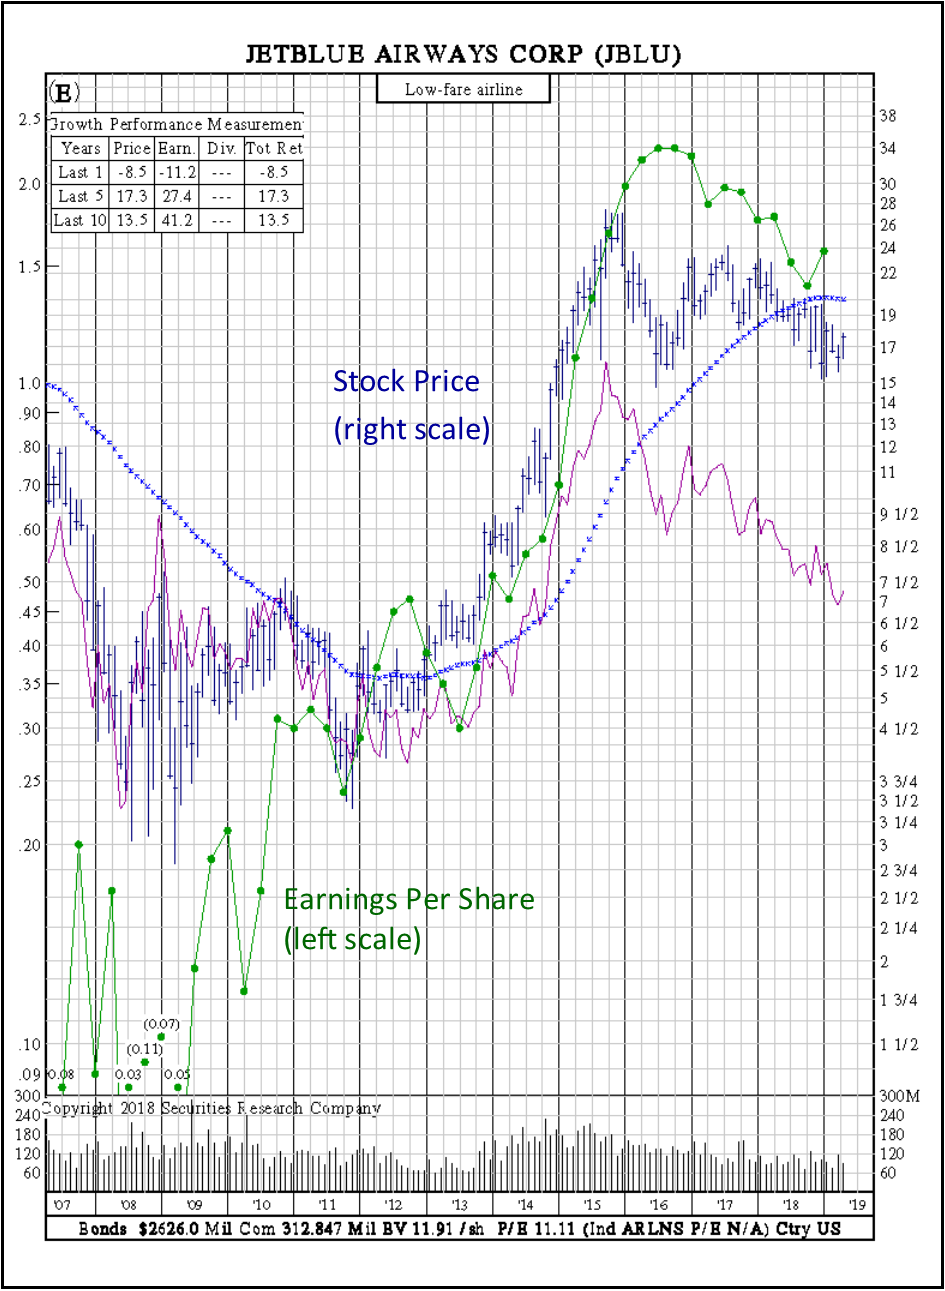
Earnings Per Share: Cyclical Stock. Below is an example of earnings per share for the JetBlue stock, an example of a cyclical stock. When the economy goes into a recession, earnings for cyclical stocks drop, and when the economy recovers as consumers start spending again, earnings as well as price, increases. Knowing when to buy a cyclical stock is important, as often the best time to do so is when the economy is down or in a recessionary period.

Earnings Per Share: Earnings Growth Calculation (CAGR)
Calculation of the earnings growth percent is derived using the last reported (adjusted) earnings on a trailing twelve month basis maintained on our system and the closest corresponding quarterly value for the current value being calculated in the time period of your selection. These values are then used to calculate the compound annual growth rate (CAGR) which is then multiplied by 100 to create a percent value.

