What does 2017 have in store for the S&P 500? (35-Year Chart Included)
 Bloomberg — A 10% rally in the S&P 500 makes geniuses of Wall Street strategists; They didn’t exactly nail every detail – but U.S. equity strategists got one thing right about 2016: where the S&P 500 Index would end up.
In fact, their accuracy in predicting the annual gain of 9.5 percent is unprecedented in Bloomberg data going back to 2000. At 2,216 last December, the mean Wall Street prediction ended up being 1 percent too low, as the benchmark gauge traveled 195 points in 12 months to close at 2,238.83.
Before anyone starts slapping high fives, it’s worth considering the market’s role in accommodating the feat. In short, stocks finally did in 2016 exactly what strategists always say they’ll do. Since 2000, the average gain foreseen by forecasters surveyed by Bloomberg has been 9.3 percent.
So what really happened is 2016’s advance came closer to 9.3 percent than any year ever.
Alas, while the projections at the start of the year were borne out, those forecasts were roundly abandoned as soon as 2016 got going. The 11 percent rout that greeted investors in January and February proved too much for Wall Street stock pickers to handle. By midyear, they’d lowered their estimated gain in the S&P 500 to 3.2 percent.
Of course, heading that pessimism would’ve been a mistake. The worst start in market history was quickly erased, Brexit’s fallout proved short-lived, and rather than spell doom for equities, Donald Trump’s November win spurred the biggest rally for any newly elected president. The value of American shares stands at $25.3 trillion today, compared with $23.5 trillion a year ago.
Strategist calls for next year are uncharacteristically dour. The S&P 500 will climb 5.2 percent in 2017, according to estimates from analysts who had made a projection by Dec. 19. But, what they lack in bullishness, they make up for in homogeneity. The top-to-bottom spread in forecasts for 2017 is the narrowest in a decade.
Companies in the S&P 500 emerged from a five quarter-long earnings recession in 2016 and are poised to rise 12 percent next year, according to analysts surveyed by Bloomberg. The growth could help bring the market’s multiple back toward historical averages after the price-earnings ratio of the S&P 500 climbed 11.6 percent to 20.96
While the start of 2016 was marked by a rush to low-volatility funds and high-yielding defensive groups like utilities and consumer staples shares, investors in the second half turned to industries that do well when the economy is expanding. At the end, most ended in the green. Here’s a breakdown of how the sectors fared:
Even with Brexit, Trump and the early-year correction, volatility in 2016, taken as a whole, resembled most other years in the bull market. The VIX averaged 15.8, down from both 16.7 in 2015 and 19.5, the average since the rally began in 2009.
The S&P 500 finished the year with the third weekly loss in five, declining 1.1 percent as a rally in real estate shares couldn’t make up for losses in 10 of 11 sectors, with consumer discretionary and tech stocks leading the declines.
SPX 35-Year Chart:
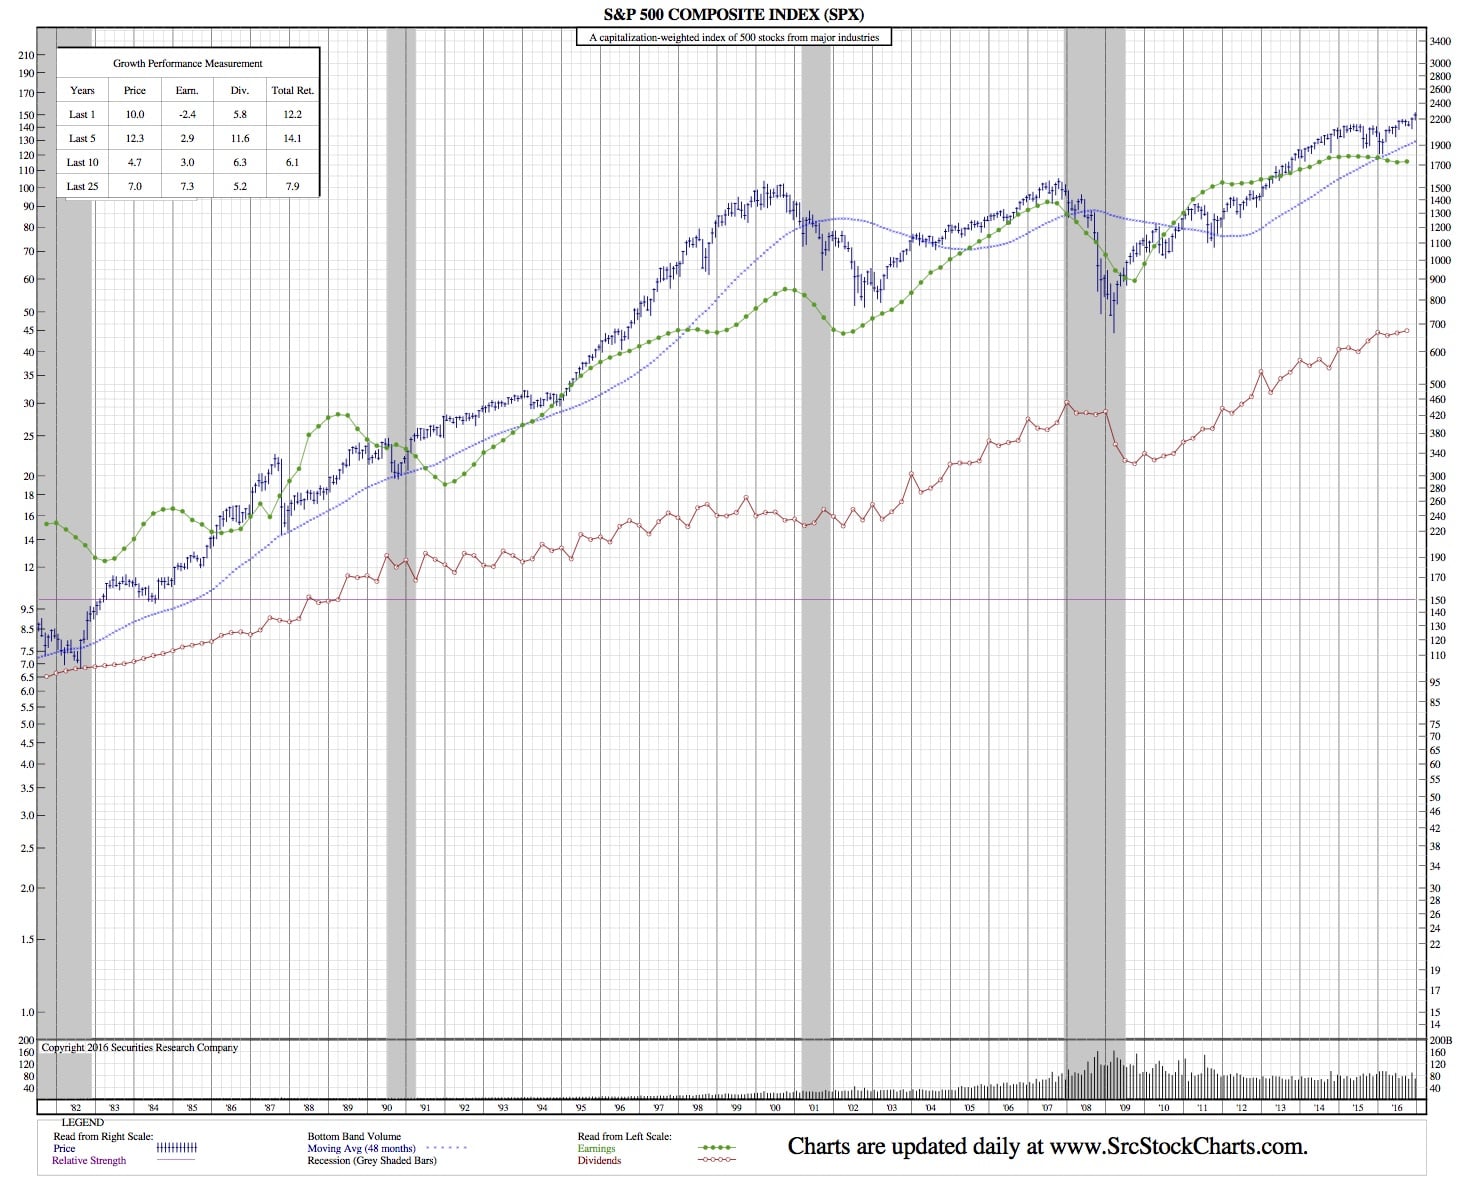
click to enlarge