SP 500 Hits Four Month Low with Election Looming – A Look at the 25-Year Chart

Photo: Business Insider
Nov 1 (Reuters) – Wall Street sold off sharply on Tuesday, with the S&P 500 touching a nearly four-month low, amid growing concern over the impending U.S. presidential election and prospects for higher U.S. interest rates.
The CBOE Volatility Index, a gauge of near-term investor anxiety, jumped to almost a two-month high.
The tumultuous presidential race between Democrat Hillary Clinton and Republican Donald Trump has appeared to tighten in the past week after news that the FBI was investigating more emails as part of a probe into Clinton’s use of a private email system.
“There is some anticipation that the markets have built in a Hillary victory, and that a Trump victory is going to roil the markets,” said Paul Nolte, portfolio manager at Kingsview Asset Management in Chicago. “And that’s why we’re seeing the market sell off here, because some of the poll numbers have tightened up over the last week.”
The selloff in equities comes as the Federal Reserve holds its two-day policy meeting, with its statement due on Wednesday. While traders do not expect the central bank to raise interest rates just a week ahead of the presidential election, they are looking for signs confirming broad expectations that the Fed is set to hike rates in December.
Real estate, telecommunications and utilities stocks – sectors that tend to perform poorly in rising rate environments – sold off especially sharply on Tuesday.
“It’s really hitting the dividend-yielding names harder than anything else…,” said Stephen Massocca, chief investment officer at Wedbush Equity Management LLC in San Francisco. “I don’t know if there is a new ‘taper tantrum’ sort of building here on concerns the Fed will act in December and the whole low-interest rate environment is about to change.”
“Taper tantrum” refers to the period in 2013 when markets were rattled by the prospect of the Fed gradually reducing its stimulus program.
The Dow Jones industrial average fell 145.04 points, or 0.8 percent, to 17,997.38, the S&P 500 lost 20.48 points, or 0.96 percent, to 2,105.67 and the Nasdaq Composite dropped 54.88 points, or 1.06 percent, to 5,134.25.
Investors also pointed to the S&P 500 breaching an important technical level as reason for stocks steepening their slide in afternoon trading.
In earnings news, Pfizer was down 2.7 percent after the drugmaker trimmed its profit forecast.
Tronc fell 16.5 percent after Gannett, the publisher of USA Today, said it had abandoned plans to buy the publisher of the Chicago Tribune and the Los Angeles Times. Gannett fell 1.4 percent.
Declining issues outnumbered advancing ones on the NYSE by a 4.37-to-1 ratio; on Nasdaq, a 2.79-to-1 ratio favored decliners.
The S&P 500 posted 5 new 52-week highs and 11 new lows; the Nasdaq Composite recorded 27 new highs and 137 new lows.
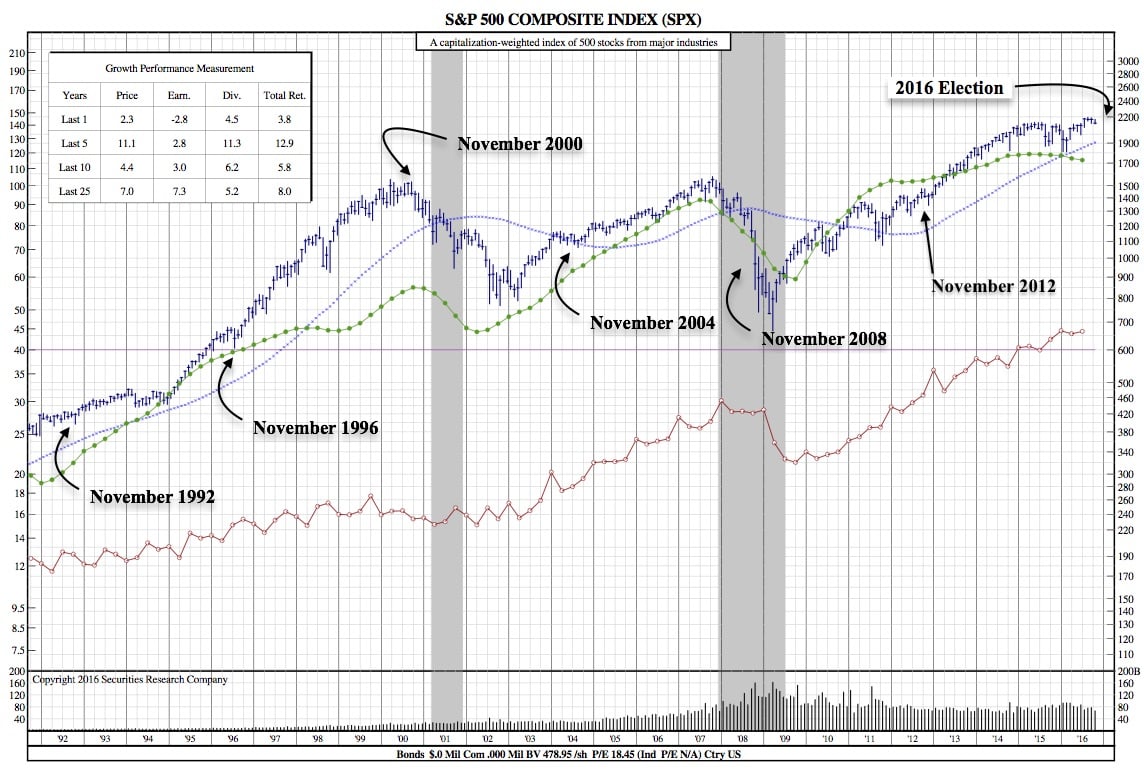
25-Year Chart:
Aside from 2000 and 2008, it can be seen that there is a noticeable drop prior to an election. In all those cases, the S&P 500 rallied shortly thereafter. It is worth noting that in the 2000 and 2008 elections, earnings were also on a downtrend, similar to how they are now, albeit not a drastic. It will be interesting to see how the dynamic takes place over the next couple of weeks and whether or not on of the previous patterns will prevail or a new one emerge.