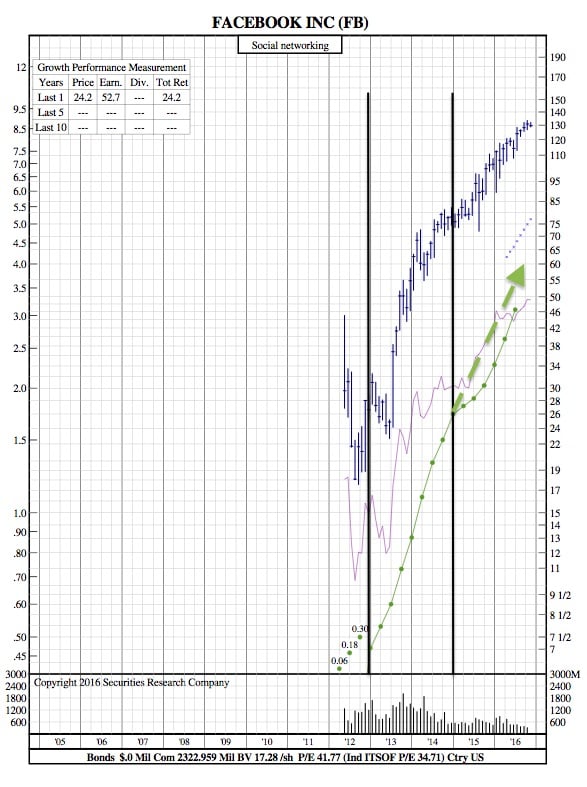
Facebook’s 12-Year Chart After it Destroys Analyst Estimates

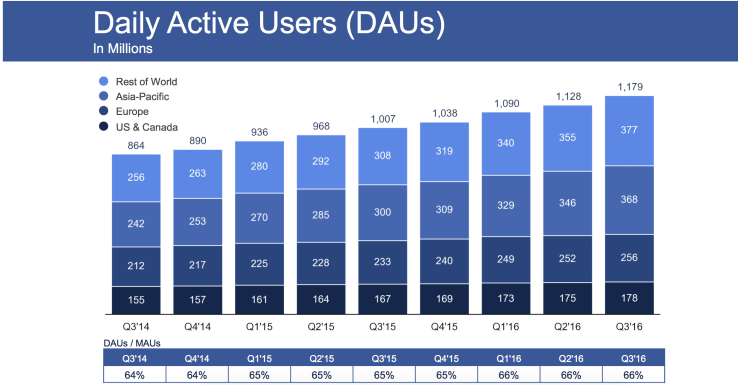
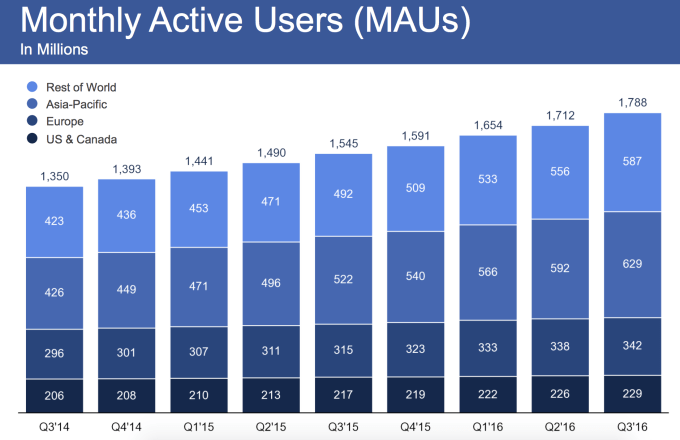
TechCrunch — Facebook had a wildly successful Q3, earning $7.01 billion in revenue and $1.09 EPS from 1.79 billion monthly users, which grew 4.67% this quarter, speeding up from 3.63% last quarter. Daily active users rose to 1.18 from 1.13 billion last quarter, and up 17% year-over-year. Facebook now has 1.66 billion mobile MAUs up 5.7% from 1.57 billion in Q2.
Facebook destroyed analyst estimates, which were $6.92 billion in revenue and $0.97 EPS. Facebook’s share price hit an all-time high of $133.50 late last month. Facebook was at $126.17 before earnings were released, and oddly down 1.45% in after hours trading.
Mark Zuckerberg summed up the progress succinctly, writing “We had another good quarter.” The company has beat earnings every quarter since it IPO’d, except for one quarter of mixed results due to foreign currency fluctuations that also hit many other tech companies.
Mobile now makes up 84% of Facebook’s ad revenue, the same as last quarter and up from 78% in Q3 2015. It earned $2.379 billion in profit, up an impressive 16% versus the $2.05 billion it raked in last quarter.
While Facebook’s business continues to chug along, the company had a tumultuous quarter in the press. It dealt with allegations of censorship of graphic but newsworthy images like the The Terror Of War photo that depicts a nude Vietnamese child, though Facebook now vows to allow more of this kind of content. The company continues to refuse the label of a “media company” despite its algorithms and content policies having a huge impact on how over a billion people get their news.