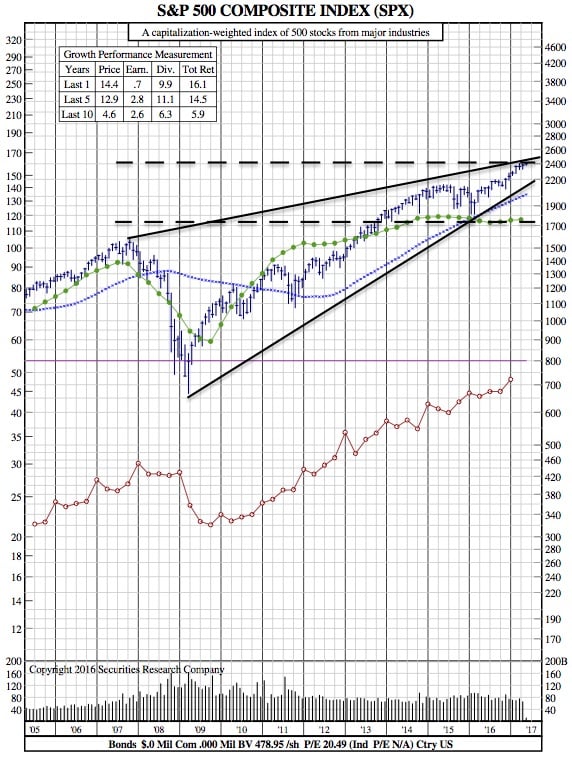
Is the S&P 500 Set to Rally Above 2,500? (SPX 12-Year Chart)

Photo: USA News – Money
CNBC — Stocks are opening the week with a sigh, as the S&P 500 (INDEX: .SPX) hovers around unchanged levels. But the index still managed to hit a narrow new all-time high in morning trading, following the 1.1 percent rally seen on Thursday and Friday.
Even more important than the fact that stocks rose were that the S&P 500 broke meaningfully above its prior resistance level of 2,400. First, hit on March 1, that level was the upper end of its multi-month sideways trading range.
Why does this matter? Because since the February 2016 lows, in the three times that the S&P has broken out of a multi-month sideways range, it has gone on to rally another 4 to 5 percent. If we see a similar rally this time around, it would take the S&P slightly above 2,500.
That does not mean the path will come in a straight line. It’s worth noting that those prior three rallies came without much of a dip, or even a pause. However, this time around, we wouldn’t be surprised to see the S&P take at least a short “breather” over the next few days.
First, volume on Friday was quite low — just over three billion shares were traded on composite volume — and breadth on the S&P 500 was barely positive. It was a bit better for the Nasdaq, which outperformed again on Friday, but the market’s breadth was not anywhere near as strong as it had been on other days in which the market saw a nice rally.
Additionally, daily sentiment data, which measures futures traders’ short-term market views, shows that bullishness on both the S&P 500 and Nasdaq (NASDAQ: .IXIC) has reached the 89 percent level. That type of level tends to indicate that many of the people who were considering buying into stocks have already done so. This is a reason why a “breather” would not surprise us at all.
If we had one glaring concern right now, it would be the state of the Treasury bond market. The 10-year Treasury yields (U.S.: US10Y) is near this year’s lows, while short-term yields have been rising thanks to the Fed’s hiking plans; as a result, the yield curve is at its flattest since October. These divergences don’t appear to matter at the moment, but as the old saying goes, “It doesn’t matter until it does.”
One strategy we think investors should strongly consider is a “bar-bell” method. The strategy looks like this: Buy technology (and a few other big momentum plays) at one end of the risk spectrum while buying up defensive names (such as utilities, consumer staples, and healthcare) at the opposite end of the risk spectrum.
We’ve been harping on the defensive stocks most of this year. One of the reasons we like this strategy is we think there is a high likelihood that technology will see a meaningful decline at some point this year given the group’s overbought condition. To be sure, this does not mean we’re worried the group is going to collapse. A 12 percent decline would still leave the group in its upward-sloping channel from early 2016.
But owning those defensive names could — and should — provide some cushion if the technology stocks do see a 10 percent correction.
We understand why institutional investors need to stay in these overbought technology names, as the stocks are working too well to avoid them. But with the XLK (NYSE Arca: XLK) information technology ETF overbought on a daily, weekly and even monthly basis, including these defensive groups in one’s investment mix is a good idea.
SPX 12-Year Chart: