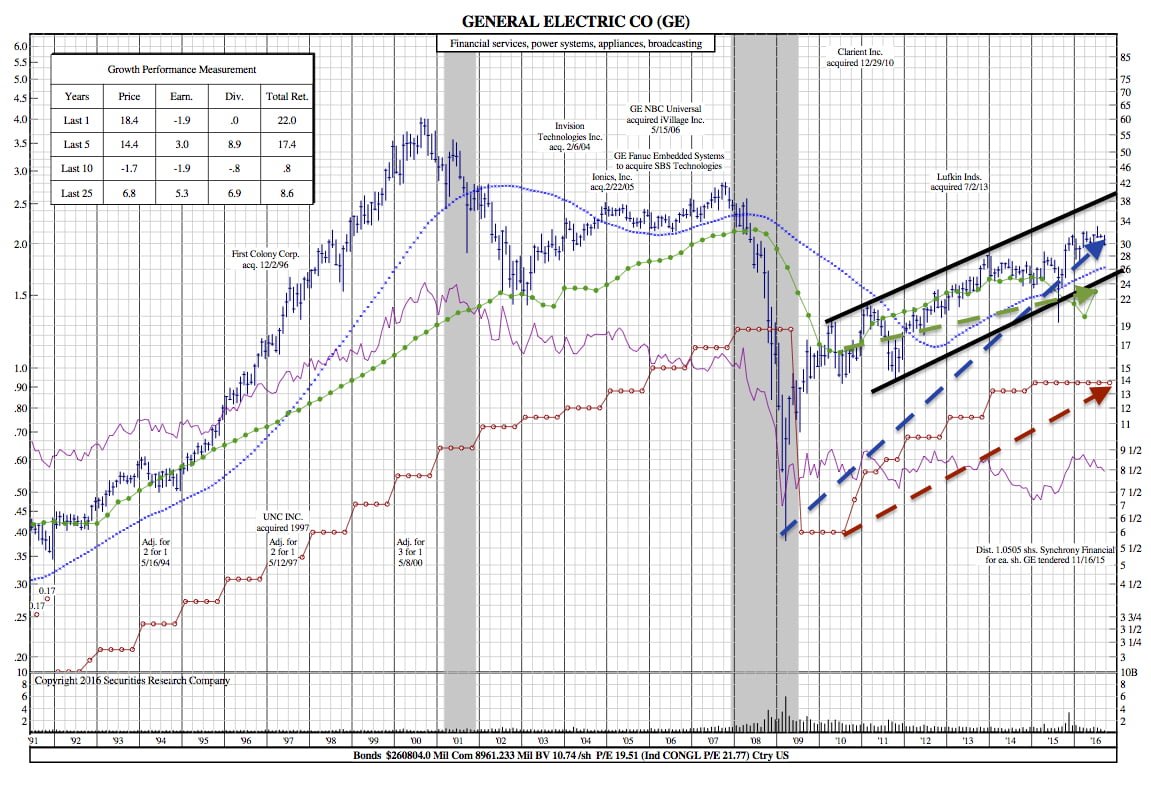
Does this 25-Year Chart Reveal When to Buy GE?

Source: Adweek
$GE was one of the major victims of last week’s selloff. General Electric was down 3% on Friday as a six-week consolidation ended with a breakdown.
After GE saw a 52 week high in July, the stock saw resistance near $33. Five days later, the stock began a steep pullback on July 22, and over the next eight sessions, the previous 10-day run was completely retraced. The stock found support near its 50-day moving average as August began and remained in an extremely narrow pattern throughout the remainder of the month.
The 25-Year Chart:
As last week’s breakdown develops, patient GE investors should keep a close eye on the $29 area. This key zone is an important support area. GE bottomed here in mid-May and then put in a slightly higher low during the Brexit flush in June. A drift down to this zone will produce a much lower-risk entry opportunity than currently available.