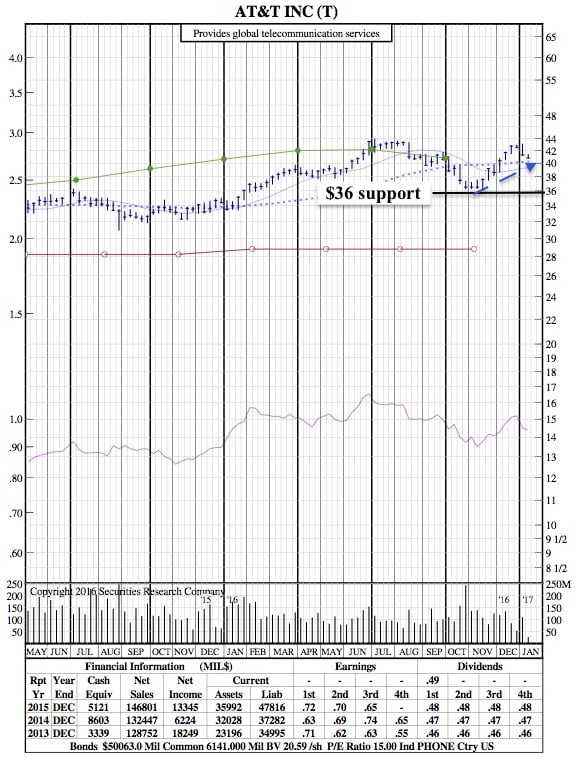
AT&T 21-Month Chart after a Rough Start to 2017

Photo: Mashable
TheStreet– AT&T (T) is working on a four-day losing streak. Shares were off 1% Monday and are now down nearly 5% from last week’s high. This steep pullback will likely carry shares lower in the near term, eventually driving AT&T back down to a major support zone.
Back in late October AT&T entered oversold territory. The stock remained under pressure into early November as well while continuing to hold major support near the $36 area. By mid-November, AT&T began to perk up as a nine-day winning streak began. As the month came to a close it was clear the stock had left behind an important bottom. AT&T continued higher throughout all of December, eventually stretching the rally off the October/November lows to nearly 20% and well into overbought territory.