A Look at the Dow Jones 12-Year Chart After Friday’s Selloff
Source: Fox Business
The $DJI wad down nearly 400 points on Friday – Boeing and 3M contributed the most to the sell-off.
Friday’s sell-off can be attributed to the tranquility that has enveloped markets for more than two months as central banks start to question the benefits of further monetary easing, sending government debt, stocks and emerging-market assets.
Fed Bank of Boston President Eric Rosengren’s comments moved him firmly into the hawkish camp, sending the odds for a rate hike this year above 60 percent. He spoke a day after ECB President Mario Draghi played down the prospect of an increase in asset purchases, while DoubleLine Capital Chief Investment Officer Jeffrey Gundlach said it’s time to prepare for higher rates. — “Dovish Fed members getting called up to bat for a hike is putting people on edge,” Yousef Abbasi, a global market strategist at JonesTrading Institutional Services LLC, said by phone. “The more hawkish-leaning investors are grabbing onto that and it’s certainly one of those days where people are positioning for that September hike being back on the table.” (Bloomberg)
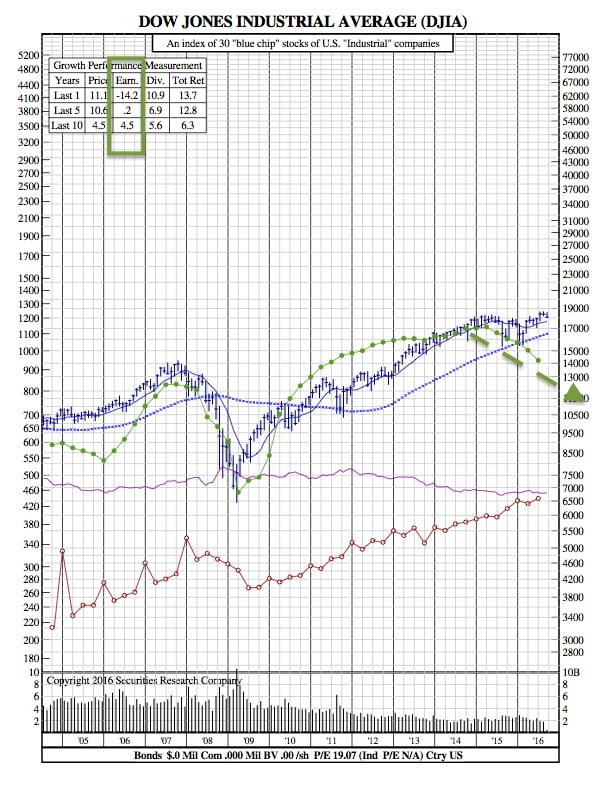
Furthermore, as we look at the DJIA 12-Year Chart from SRC, it’s clear that another contributing factor is the decline in earnings. It’s noted in the top left corner that over the past year, earnings have declined 14.2% on average across the stocks that make up the Dow. It’s also worth noting that there is a steady downtrend in overall volume noted at the bottom of the chart.