This 21-Month Chart Helps Explain Bank of America’s 11% Rise in August

Source: Business Insider
Among the 8 banks that matter most, Bank of America has had the best performance thus far during August. At the beginning of the month $BAC was trading around $14.50 per share. Now, it’s trading above $16 – a strong 11.5% gain.
So what is driving BofA’s price higher?
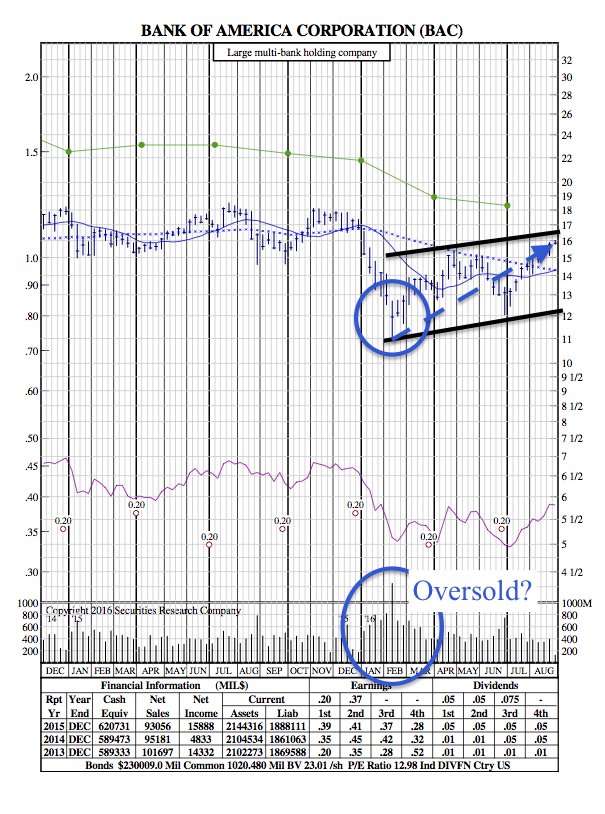
First, as you can see in SRC’s 21-Month chart (below), the stock (and financial sector at large) was hit rather hard at the beginning of year when quite a few factors led investors to sell their holdings. A few examples include: decelerating growth in China, the beginnings of “Brexit,” and low oil prices caused energy companies to begin defaulting on loan obligations. So it’s safe to say, Bank of America’s stock was due for a rebound; especially considering earnings (green line) are still higher than what the price reflects.
The second factor that has contributed to the recent rise in price involves the prospect of the Federal Reserve increasing interest rates. Rates have begun raising since end of 2015 – to around .25% – but it hasn’t been raised since. Now, investors are hopeful that the next rate increase will drastically increase income for a banks.
In Bank of America’s case, it would earn an additional $7.5 billion in net interest income if short- and long-term rates increase by only 100 basis points, or 1%. That’s sorely needed for a bank that has struggled to generate a consistent and respectable profit in nearly a decade. (Yahoo Finance)