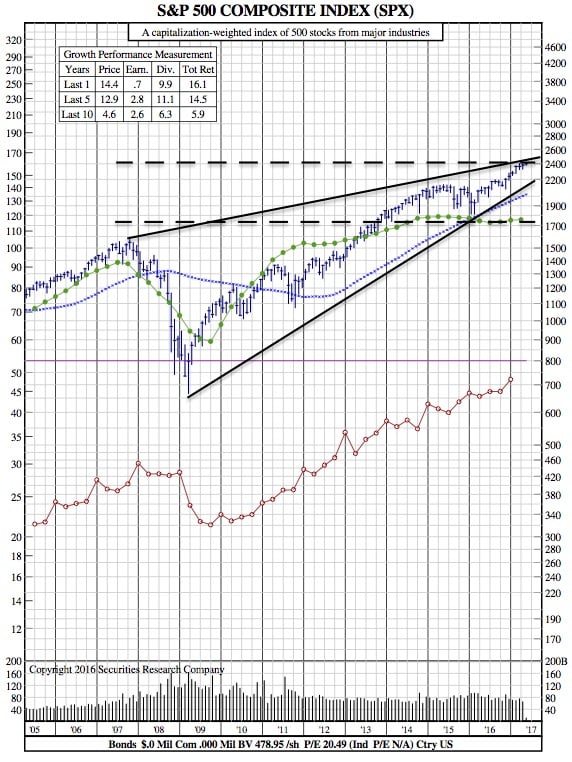
The S&P 500 Posts Another Unprecedented Move (12-Year Chart)
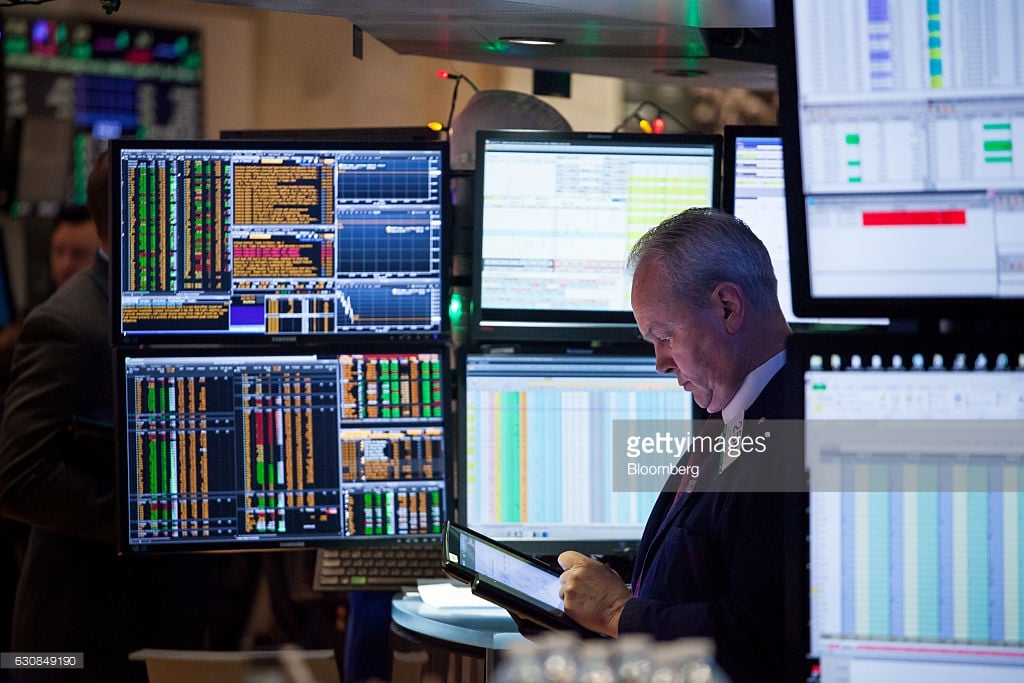
Photo: Getty Images
CNBC — In the 10 sessions through Monday, the S&P 500 (INDEX: .SPX) has moved in the smallest range ever for such a period, according to a CNBC analysis of FactSet data going back to 1980.
While the low volatility that has marked the prior two weeks is certainly anomalous, it is part and parcel of the more general trend of declining market moves. Out of the 9,312 10-session periods the S&P 500 has seen since mid-1980, the S&P has traded in a range smaller than 1 percent in just 10 of them; five of those periods have come in the past year.
The prior 10 periods including Monday have seen an S&P 500 range of just 19.54 points, or 0.82 percent. That’s narrowly smaller than the 0.83 percent range seen at the end of July 2016.
Erin Gibbs of S&P Global pins the lack of movement on positive first-quarter earnings, a low rate of earnings misses, and stability in earnings growth estimates. “We’re just getting exactly what we expected three months ago,” she said Friday on CNBC’s ” Power Lunch .”
Another cause of the low broad-market movement is the decline in correlations. Individual stocks and sectors are not moving as closely together as they had before, which makes it more difficult for an entire index to see a large (mono-directional) move.
It is worth noting that the low level of actual volatility explains the low readings seen for the CBOE volatility index (STOXX: .VIX) or the VIX. It is hard for traders to bet on high volatility in the near future when the near past has been marked by almost utter stagnation.
Besides late July 2016, other sessions with 10-day ranges below 1 percent were seen in August 1993 and January 1994, based on FactSet data.
SPX 12-Year Chart: