Is the S&P 500 Undervalued? A look at the 35-Year Chart…
 MarketWatch — The stock market may actually be undervalued.
That’s the surprising conclusion reached by a stock-market indicator introduced last summer by Darien Huang, a finance professor at Cornell University. His research found it to have a better track record than nearly all of the many others he studied—including such well-known valuation indicators as the Shiller P/E ratio (otherwise known as the Cyclically Adjusted P/E Ratio, or CAPE), the price-to-dividend ratio, and so forth.
It’s not just the bears who will be surprised by this conclusion. The bulls will also since they long ago resigned themselves to merely pointing out that an overvalued stock market could continue going up for at least a while.
Professor Huang’s indicator is based on the price ratio of gold GCM7, +0.32% to platinum PLV7, +0.59%. It works, he told me in an interview, because platinum is a purer play on industrial demand than is gold GLD, +0.23%. Bullion, of course, at least partially reflects investor demand for a disaster hedge. So when the ratio is high—as it is now—then the market is discounting a higher-than-average degree of risk. And that, in turn, means that equities must deliver a higher-than-average expected return as compensation for that risk.
Since 1975, his research found, this simple indicator had a better track record than the nine other indicators that academics have found to have predictive ability.
Professor Huang’s research began circulating in academic circles this past August, and in a column, at that time I reported that its forecast on equities was bullish. Even though the S&P 500 SPX, +0.06% is up close to 10% since then, this indicator is just as bullish today as it was then.
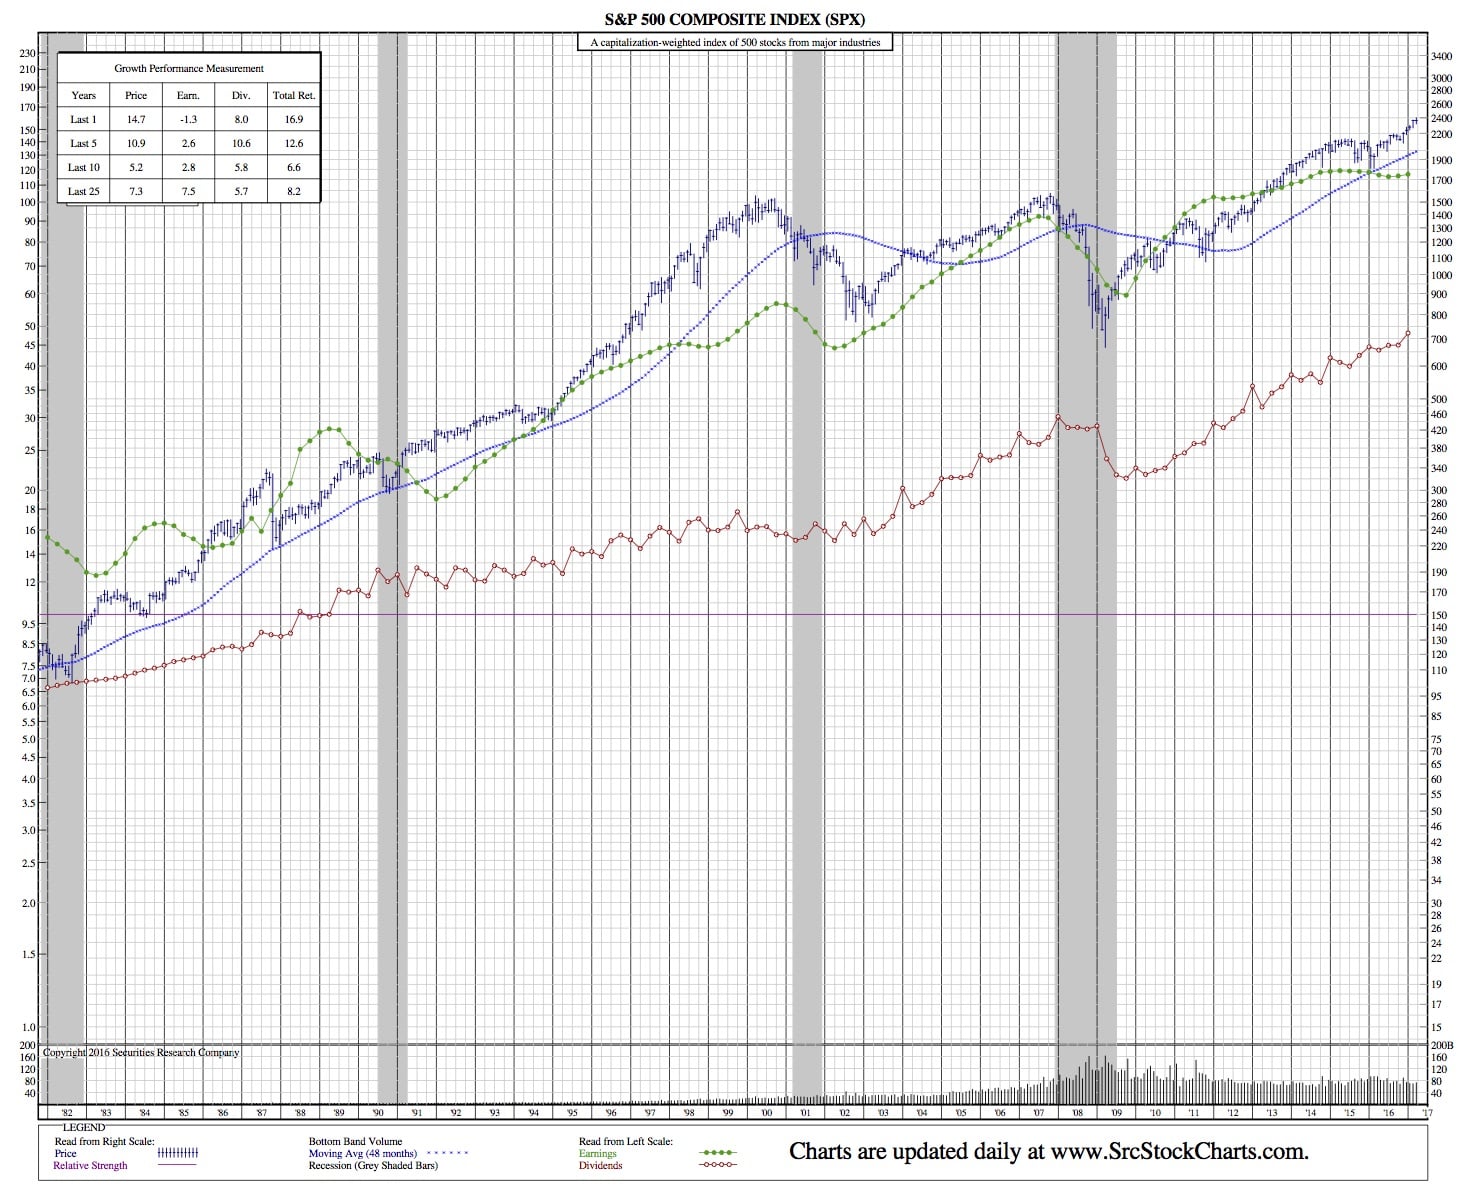
SPX 35-Year Chart:
Several qualifications are in order as you translate what this indicator’s current message into your portfolio. First, even though it has a better track record than many other well-known indicators, it by no means amounts to a guarantee of higher prices. So don’t throw caution to the winds.
The second qualification: The indicator’s maximum explanatory power historically came at the one- to two-year horizon, which means that a near-term pullback wouldn’t necessarily be inconsistent with its longer-term bullish message.
Still, it should provide at least some comfort to the bulls to know that not all valuation indicators are saying that the stock market is hugely overvalued.