Dow Jones Hits 19,000 – A look at its 25-Year Chart and what Happened After Previous Milestones

Photo: RTE
The Dow Jones Industrial Average (Dow Jones Global Indexes: .DJI) hit all-time highs and closed above 19,000 on Tuesday for the first time. That psychological triple-zero barrier suggests more gains are to come should the index close above that mark.
Based on market data from the past 30 years, when the Dow has closed above levels like 2,000, 3,000, 4,000 … all the way to 18,000, we can expect traders to push it up even higher, according to data from analytics tool Kensho . The Dow doesn’t just go up, but it outperforms the S&P 500 (^GSPC) along the way.
The trend is true not just for a quick one-week return, but also one-month and one-quarter returns. Here’s a full summary of the data, going back to January 1987, when the Dow closed above 2,000 for the first time. That’s 17 different instances, all the way through the first close above 18,000 in December 2014.
On a one-month basis, the Dow has outperformed the S&P 500 13 of the past 17 past times.
Those -000 multiples get extra attention in the media (as this article demonstrates), encouraging more people to jump on board. Such mental and optical effects also relate to technical trading, where investors focus on chart movements and specific levels of “support” and “resistance.” Breaking through any -000 number is a real event that people can flock toward to push assets higher.
A market move through a -000 level also suggests a shift on the chart: Levels that had been considered resistance — psychological barriers against going higher — turn into levels of support — barriers against dropping lower. Consider the scenario we are in: A Dow below 19,000 is still pushing on that ceiling, but once it breaks above 19,000, it just has blue sky and room to run.
Take a look at one example from mid-2007, when the Dow closed above 13,000 for the first time. You’ll see specifically how the Dow then took off relative to the S&P 500, outperforming by almost 4 percent in just three months.
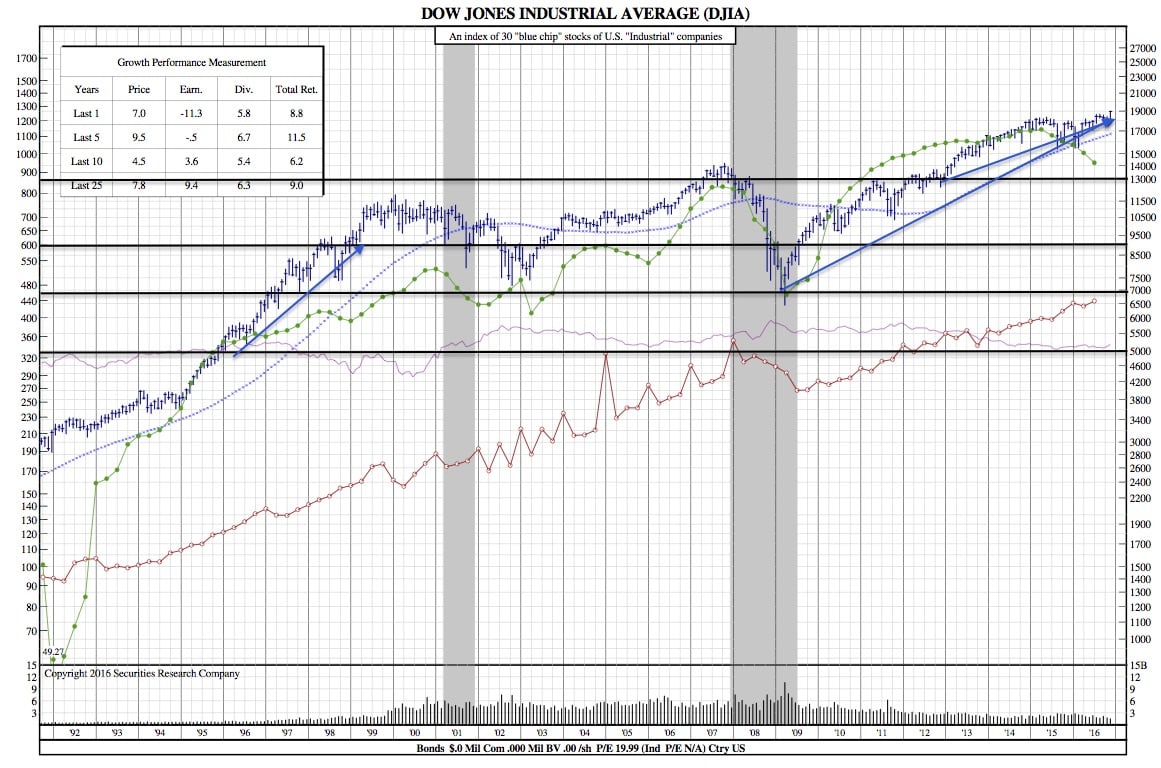
DJIA 25-Year Chart:
As noted above, for the past 30 years, when the Dow has closed above levels like 2,000, 3,000, 4,000 … all the way to 18,000, we can expect traders to push it up even higher. The most notable in the chart below are the 5,000 lvl, 7,000 lvl, and 13,000 lvl. Each of these marks have provided remarkable bullish runs thereafter.