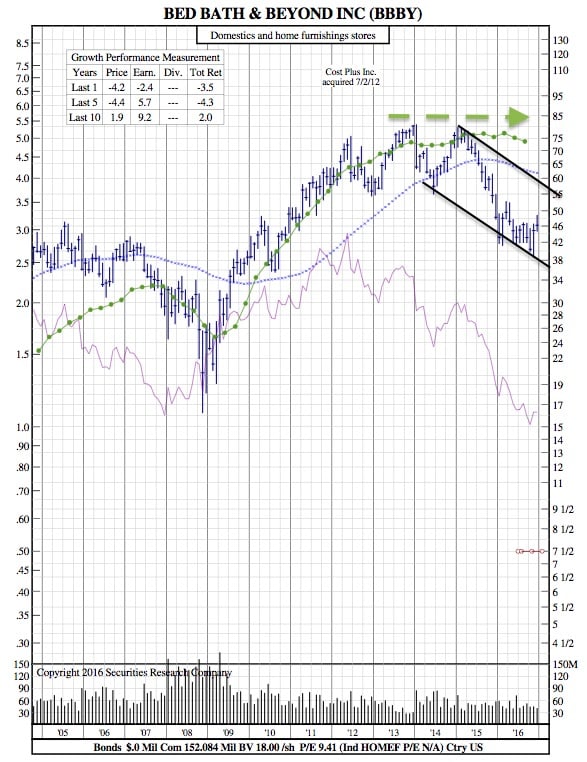
Bed Bath & Beyond 12-Year Chart after Weak Q3 Earnings Report

Photo: Bloomberg
PRNewswire/ — Bed Bath & Beyond Inc. (BBBY) today reported financial results for the third quarter of fiscal 2016 ended November 26, 2016.
Third Quarter Results
For the third quarter of fiscal 2016, the Company reported net earnings of $.85 per diluted share ($126.4 million) compared with $1.09 per diluted share ($177.8 million) for the third quarter of fiscal 2015. Net sales for the third quarter of fiscal 2016 were approximately $2.955 billion, an increase of approximately 0.1% from net sales of approximately $2.952 billion reported in the third quarter of fiscal 2015. Comparable sales in the third quarter of fiscal 2016 decreased by approximately 1.4%, compared with a decrease of approximately 0.4% in last year’s fiscal third quarter. Comparable sales from customer-facing digital channels grew in excess of 20% while comparable sales from stores declined in the low single-digit percentage range during the third quarter of fiscal 2016.
Capital Allocation
The Company’s Board of Directors has declared a quarterly dividend of $.125 per share, to be paid on April 18, 2017 to shareholders of record at the close of business on March 17, 2017.
During the third quarter of fiscal 2016, the Company repurchased approximately $76 million of its common stock, representing approximately 1.8 million shares, under its existing $2.5 billion share repurchase program. As of November 26, 2016, the program had a remaining balance of approximately $1.9 billion, and is expected to be completed sometime in fiscal 2020.
Fiscal 2016 Outlook
Bed Bath & Beyond Inc.’s conference call with analysts and investors will be held today at 5:00 pm (ET). During this call, the Company plans to review some of its financial planning assumptions for fiscal 2016.
Based on these planning assumptions, which reflect actual results through the fiscal third quarter, including One Kings Lane, Inc., and PersonalizationMall.com since their dates of acquisition, and recent business conditions, the Company models its fiscal 2016 net earnings per diluted share to be at the low end of the $4.50 to just over $5.00 range that it has earned over the past several years, during a heavy investment phase. This is the historical range of net earnings per diluted share that the Company described in previous earnings press releases.
One Kings Lane, Inc. is excluded from the comparable sales calculation and will continue to be excluded until a point following the anniversary of the acquisition, after the re-platforming of One Kings Lane, Inc.’s systems and integration of its support services have been in place to allow for a meaningful comparison of One Kings Lane, Inc.’s sales over the prior period. PersonalizationMall.com is also excluded from the comparable sales calculation and will continue to be excluded until after the anniversary of the acquisition.
BBBY 12-Year Chart: