After Lululemon’s Latest Earnings Report, We Take a Look at the 12-Year Chart to Make Sense of What To Do Next
Source: CBCNews
Lululemon reported its second-quarter earnings rose to $53.6 million, 39 cents a share, from $47.7 million, or 34 cents a share, a year earlier. Revenue grew 14% to $514.5 million and total comparable sales, which include both store and direct to consumer sales, increased 4%. (Lululemon)
Analysts surveyed by FactSet had forecast the yoga-wear maker to earn 38 cents a share on revenue of $516 million. In the third quarter, the company expects earnings per share of 42 cents to 44 cents and projected revenue of $535 million to $545 million which are on the lower end of the Street’s projected ranges. Lululemon shares shed more than 7% after hours. (Dow Jones Business News)
So, is it time to sell $LULU or is this a buying opportunity?
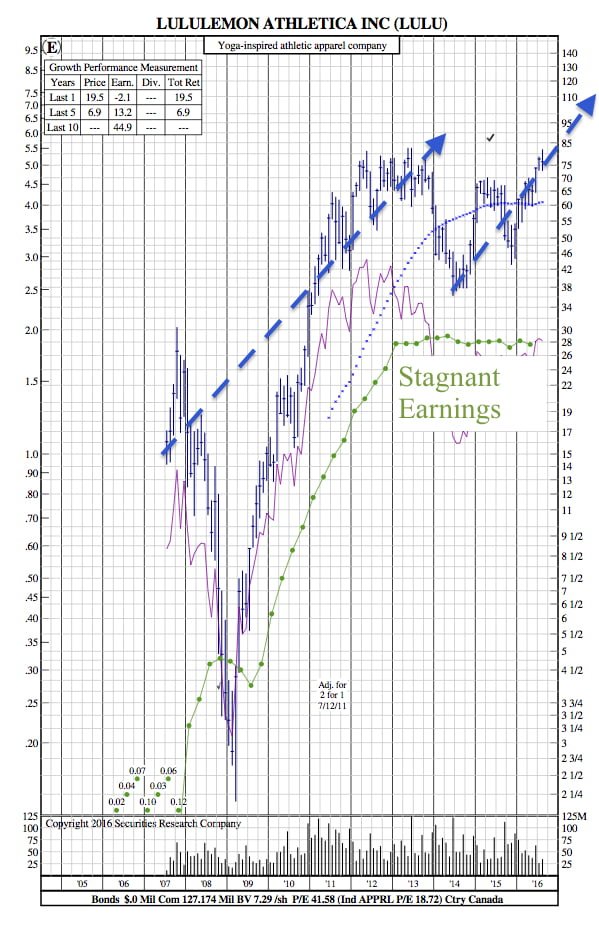
Looking at the SRC 12-Year Chart, the glaring price growth is what jumps out first. We see that a similar growth trend is taking place as it did (in terms of % rate) from 2007-2013. The main difference during that time period, however, is the impressive earnings growth. When we look at the current growth trend, it’s hard to understand what’s fueling it exactly – It’s certainly not earnings. In the last year earnings have averaged a growth rate of -2.1% (see upper left portion of chart). Based on the insights the 12-Year Chart provides, one would likely see this as a sell opportunity.
It is worth noting that Lululemon still has the opportunity to pivot towards (or at least operate an additional sales channel) the wholesale market.
Asked in an interview earlier this summer if Lululemon would ever consider branching into a wholesale model—the primary sales format for rivals Adidas, Under Armour and Nike Inc.—Chief Executive Laurent Potdevin said it was unlikely but “never say never.” (MarketWatch)