After a 7-Year Bull Market, the Dow 20,000 Milestone may Indicate the Party is Over

Photo: Snider Advisors
On January 6th, 2017, The Dow Jones Industrial Average — the most well known of indices — came within 36.2 points of the coveted 20,000 milestone. The DJIA will inevitably hit this mark at some point – the debate is whether or not it will be a cause for celebration or concern.
Below is a brief history of DJIA Milestones and 50-Year Charts:
The Dow closed at a humble 40.94 on its first day, May 26, 1896. It took the Dow nearly 10 years to reach its first milestone of 100 on Jan. 12, 1906. (Bloomberg)
The Dow consisted of companies with obscure names like Distilling & Cattle Feeding and Tennessee Coal & Iron, these obscure companies repaid investors with a return of 145% since the Dow’s inception. (1728.org)
That’s a rather disappointing return: a meager 0.8% over those four decades.
It consisted of two of the most infamous bear markets in history — the Dow declined by 47% from November 1919 to August 1921. This first scare was followed by the Roaring Twenties, and the Dow returned a whopping 497% from August 1921 to September 1929. That was then followed by the notorious Great Depression (The Dow gave up 89% of its value from September 1929 to July 1932.)
There would be one last scare during that 36-Year period. After recovering from the depths of the Great Depression, the Dow tumbled 49% from March 1937 to March 1938. It would take four more years for the Dow to finally cross over 100 for the last time.
Dow 1,000:
The Dow closed at 1,003.16 on Nov. 14, 1972. The Dow had returned 892% during the three decades from May 1942 to November 1972 — a nearly tenfold increase. (Bloomberg)
It’s popularly known (and recalled by older investors) that investors were exuberant about the Dow’s new milestone. It was the height of the “Nifty Fifty” craze — the idea that anyone could get rich by buying the 50 most popular large-cap U.S. stocks. Investors were oblivious to the pending decade-long disappointment that lay ahead.
The “Nifty Fifty” craze came to an abrupt end when then Dow tumbled 45% from January 1973 to December 1974. The Dow would revisit that 1,000 level several times for eight years, finally turning the corner on Dec. 17, 1982, when it closed at 1,011.5. The Dow returned just 0.8% during that decade.
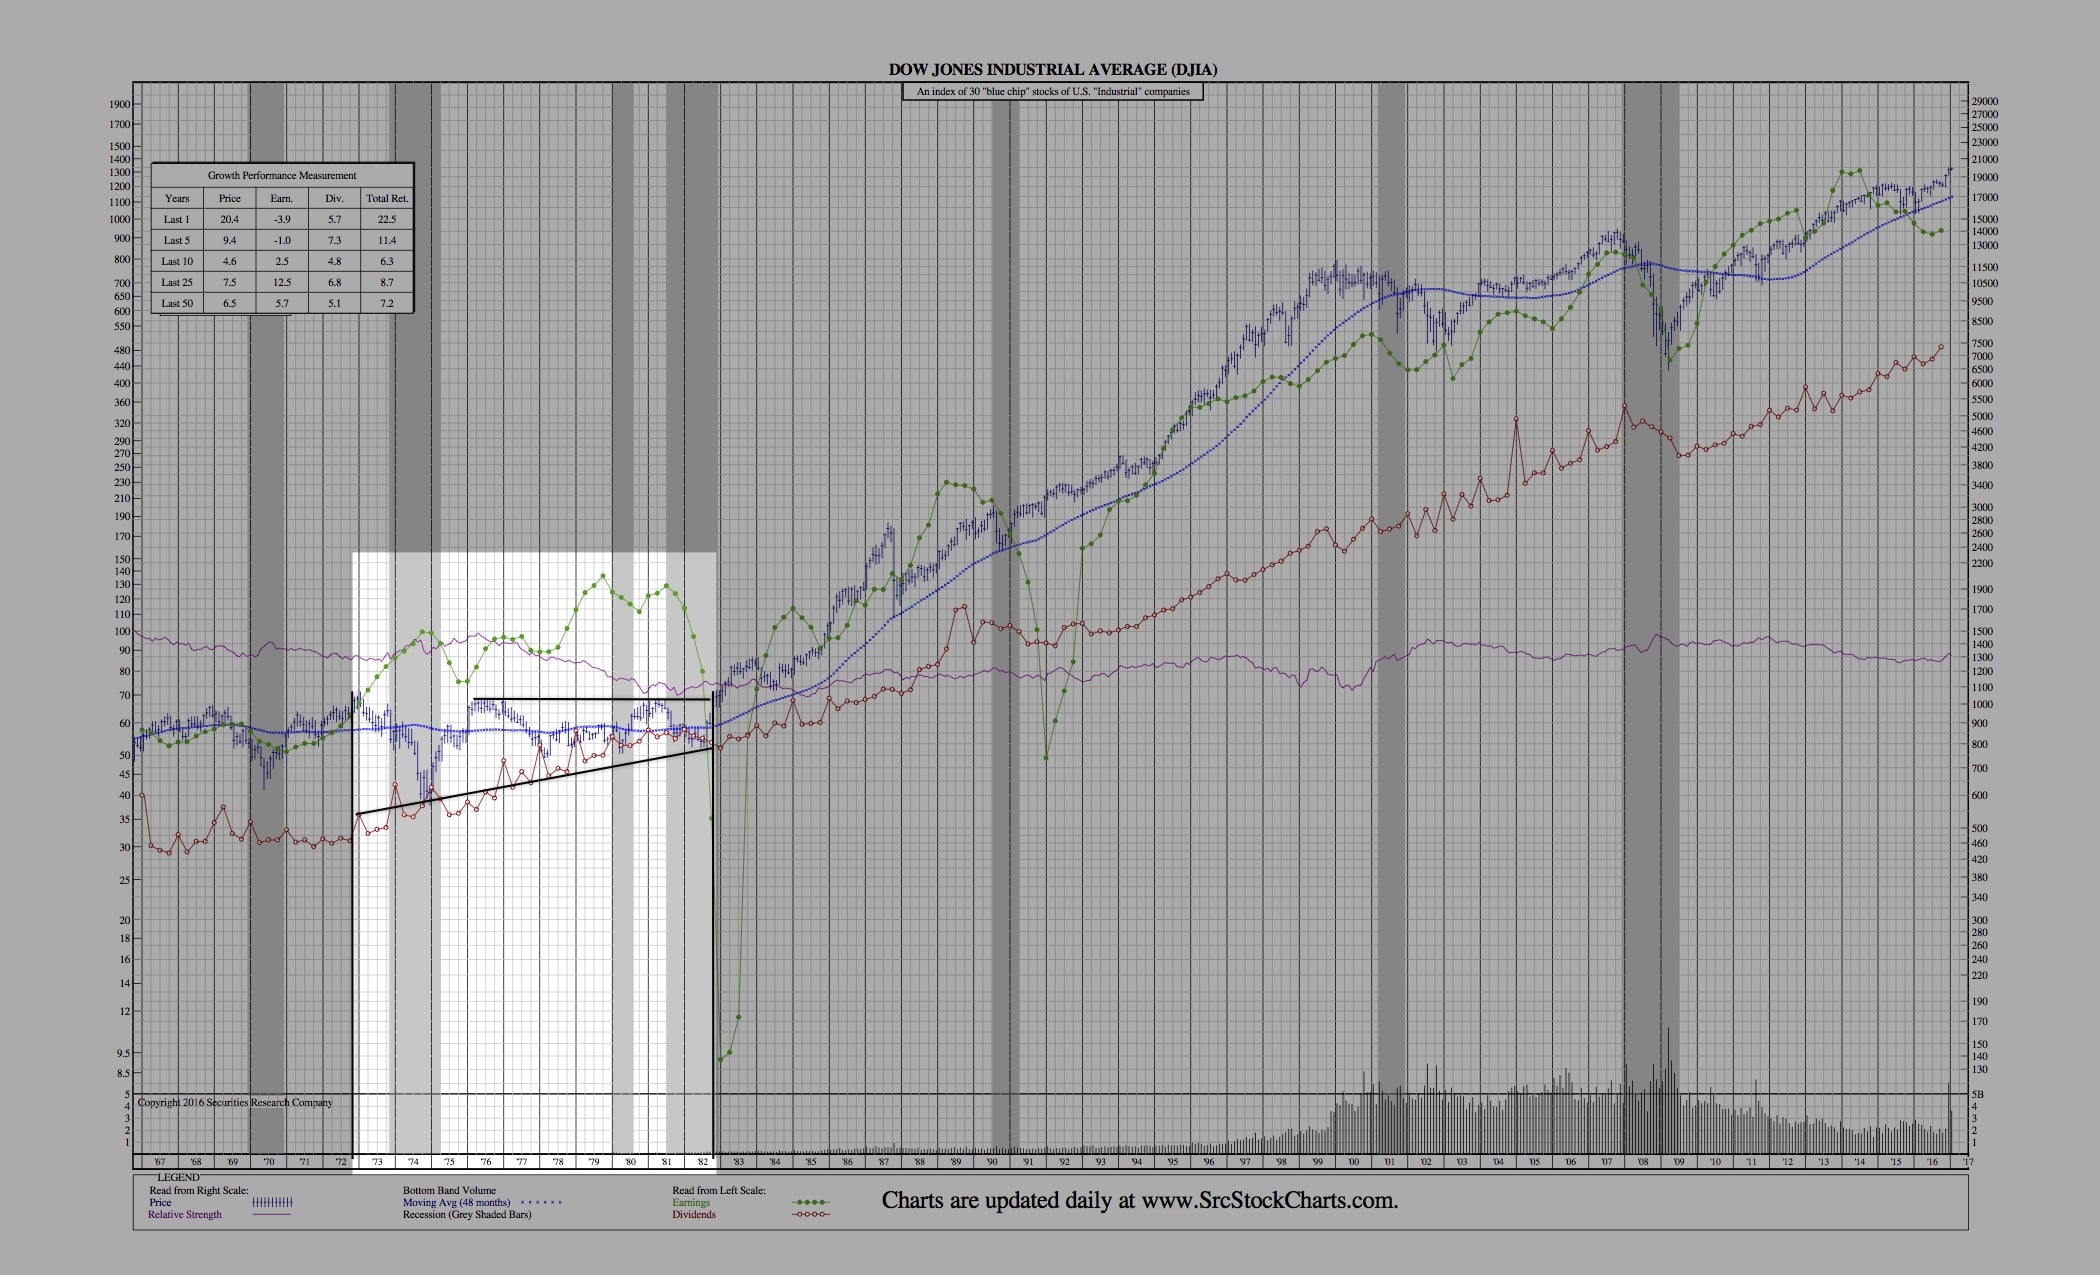
Click to enlarge
Dow 10,000:
The Dow closed at 10,006.78 on March 29, 1999, near the height of the dot-com bubble. The Dow returned 889% from December 1982 to March 1999 (Bloomberg).
Many of you likely remember that euphoric era – when anyone with a discount brokerage account was deemed a prosperous millionaire. But with more than a hundred years of the Dow’s history behind investors, they should have known the celebration was premature.
In a mirror-like fashion to the 70’s, the Dow fell 38% from January 2000 to October 2002. Again, it would take eight years for the Dow to leave 10,000 behind for good. The Dow returned 1.4% during that decade from March 1999 to August 2010.
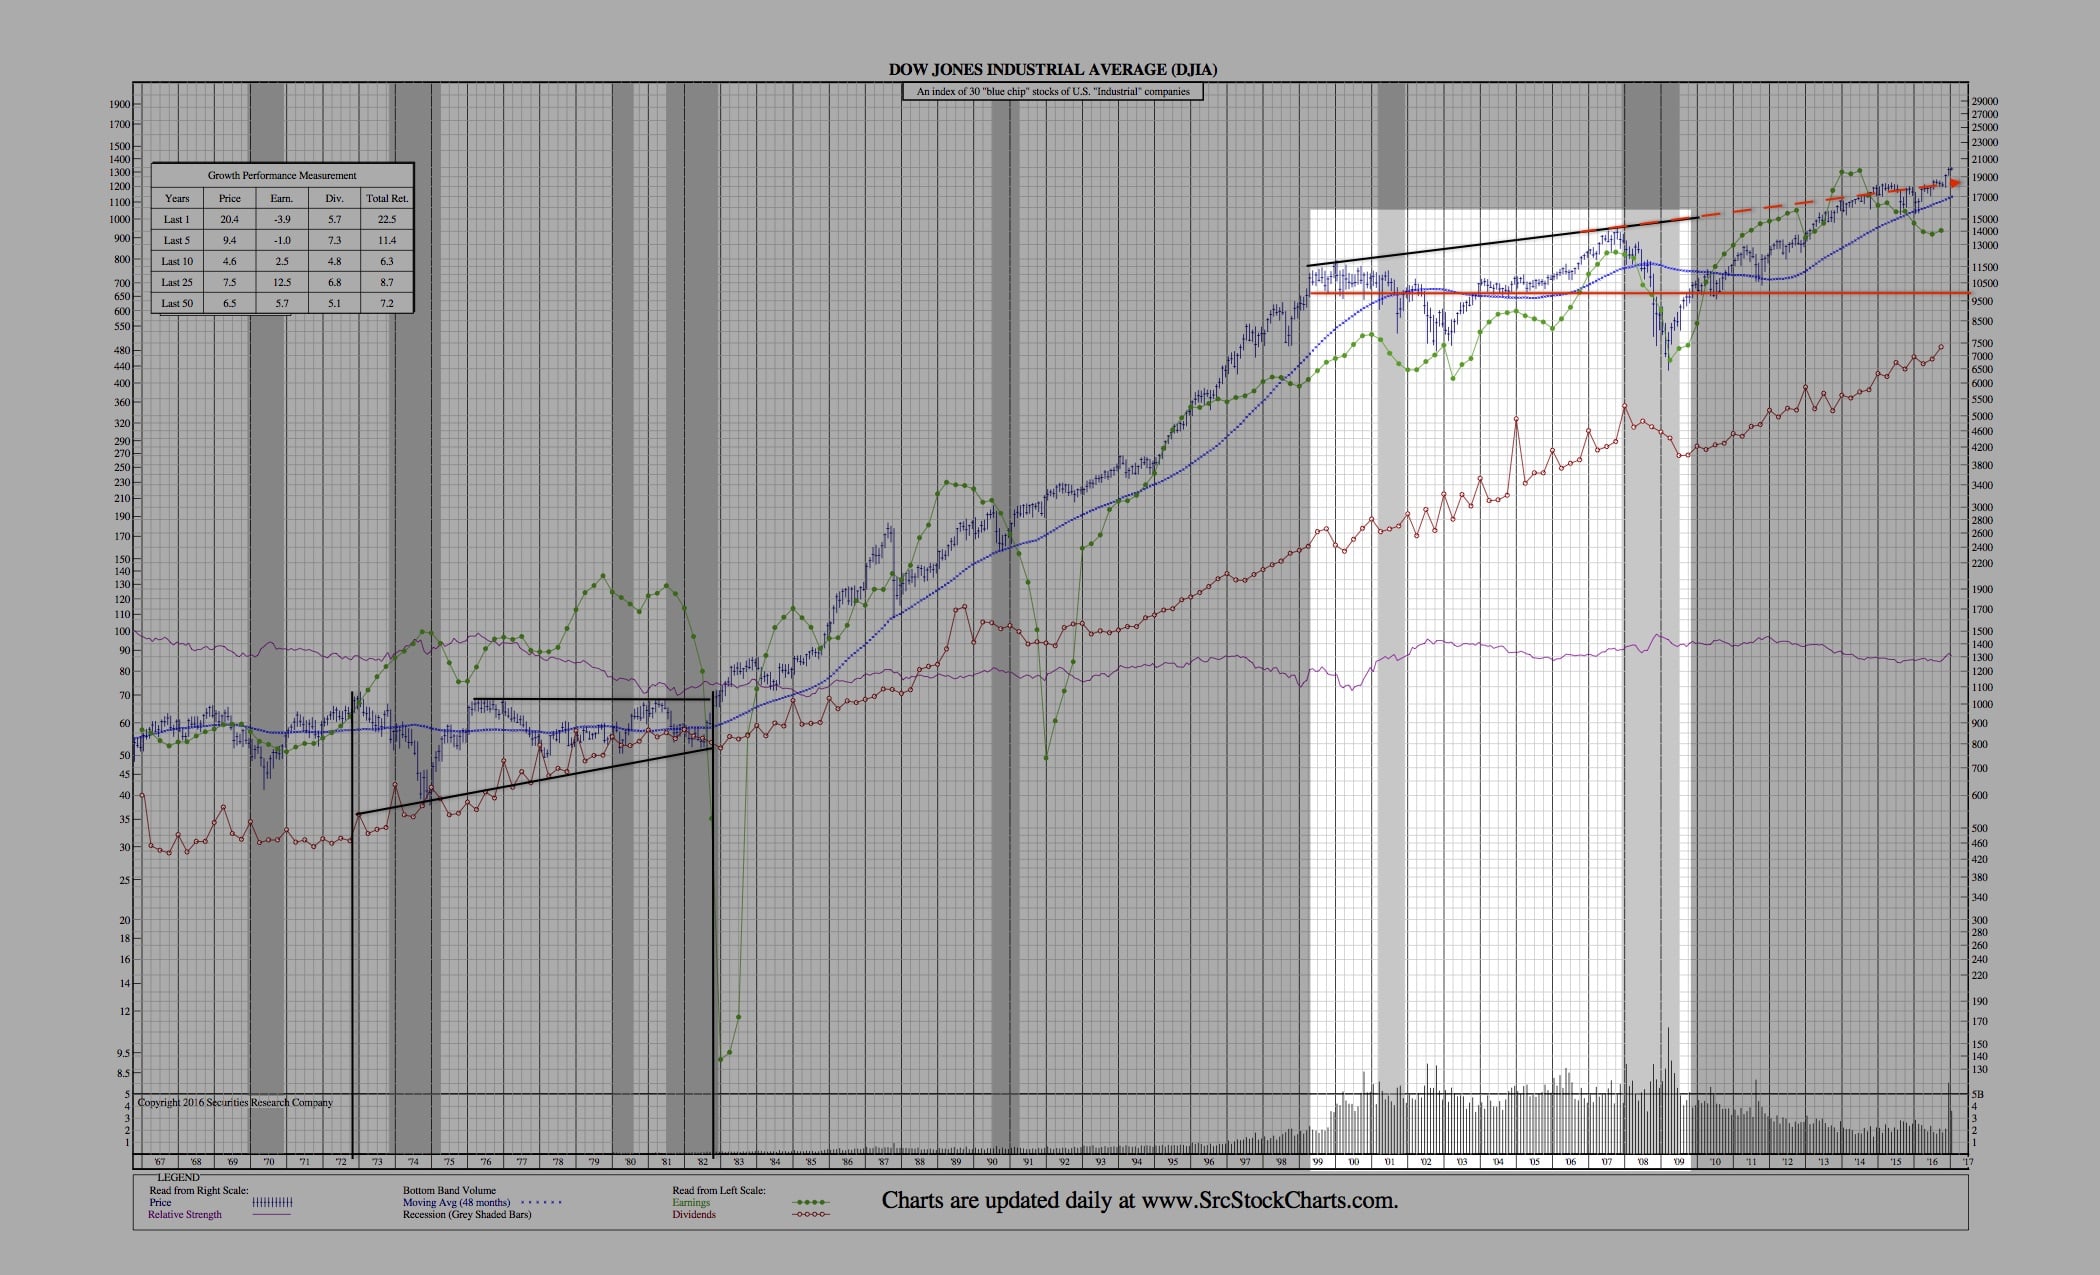
click to enlarge
Dow 20,000:
When the Dow finally reaches 20,000, it will have returned 97% since August 2010. This is definitely a call for celebration when it comes – but investors be wary, it may mark the beginning of a new – and perhaps drier – chapter.
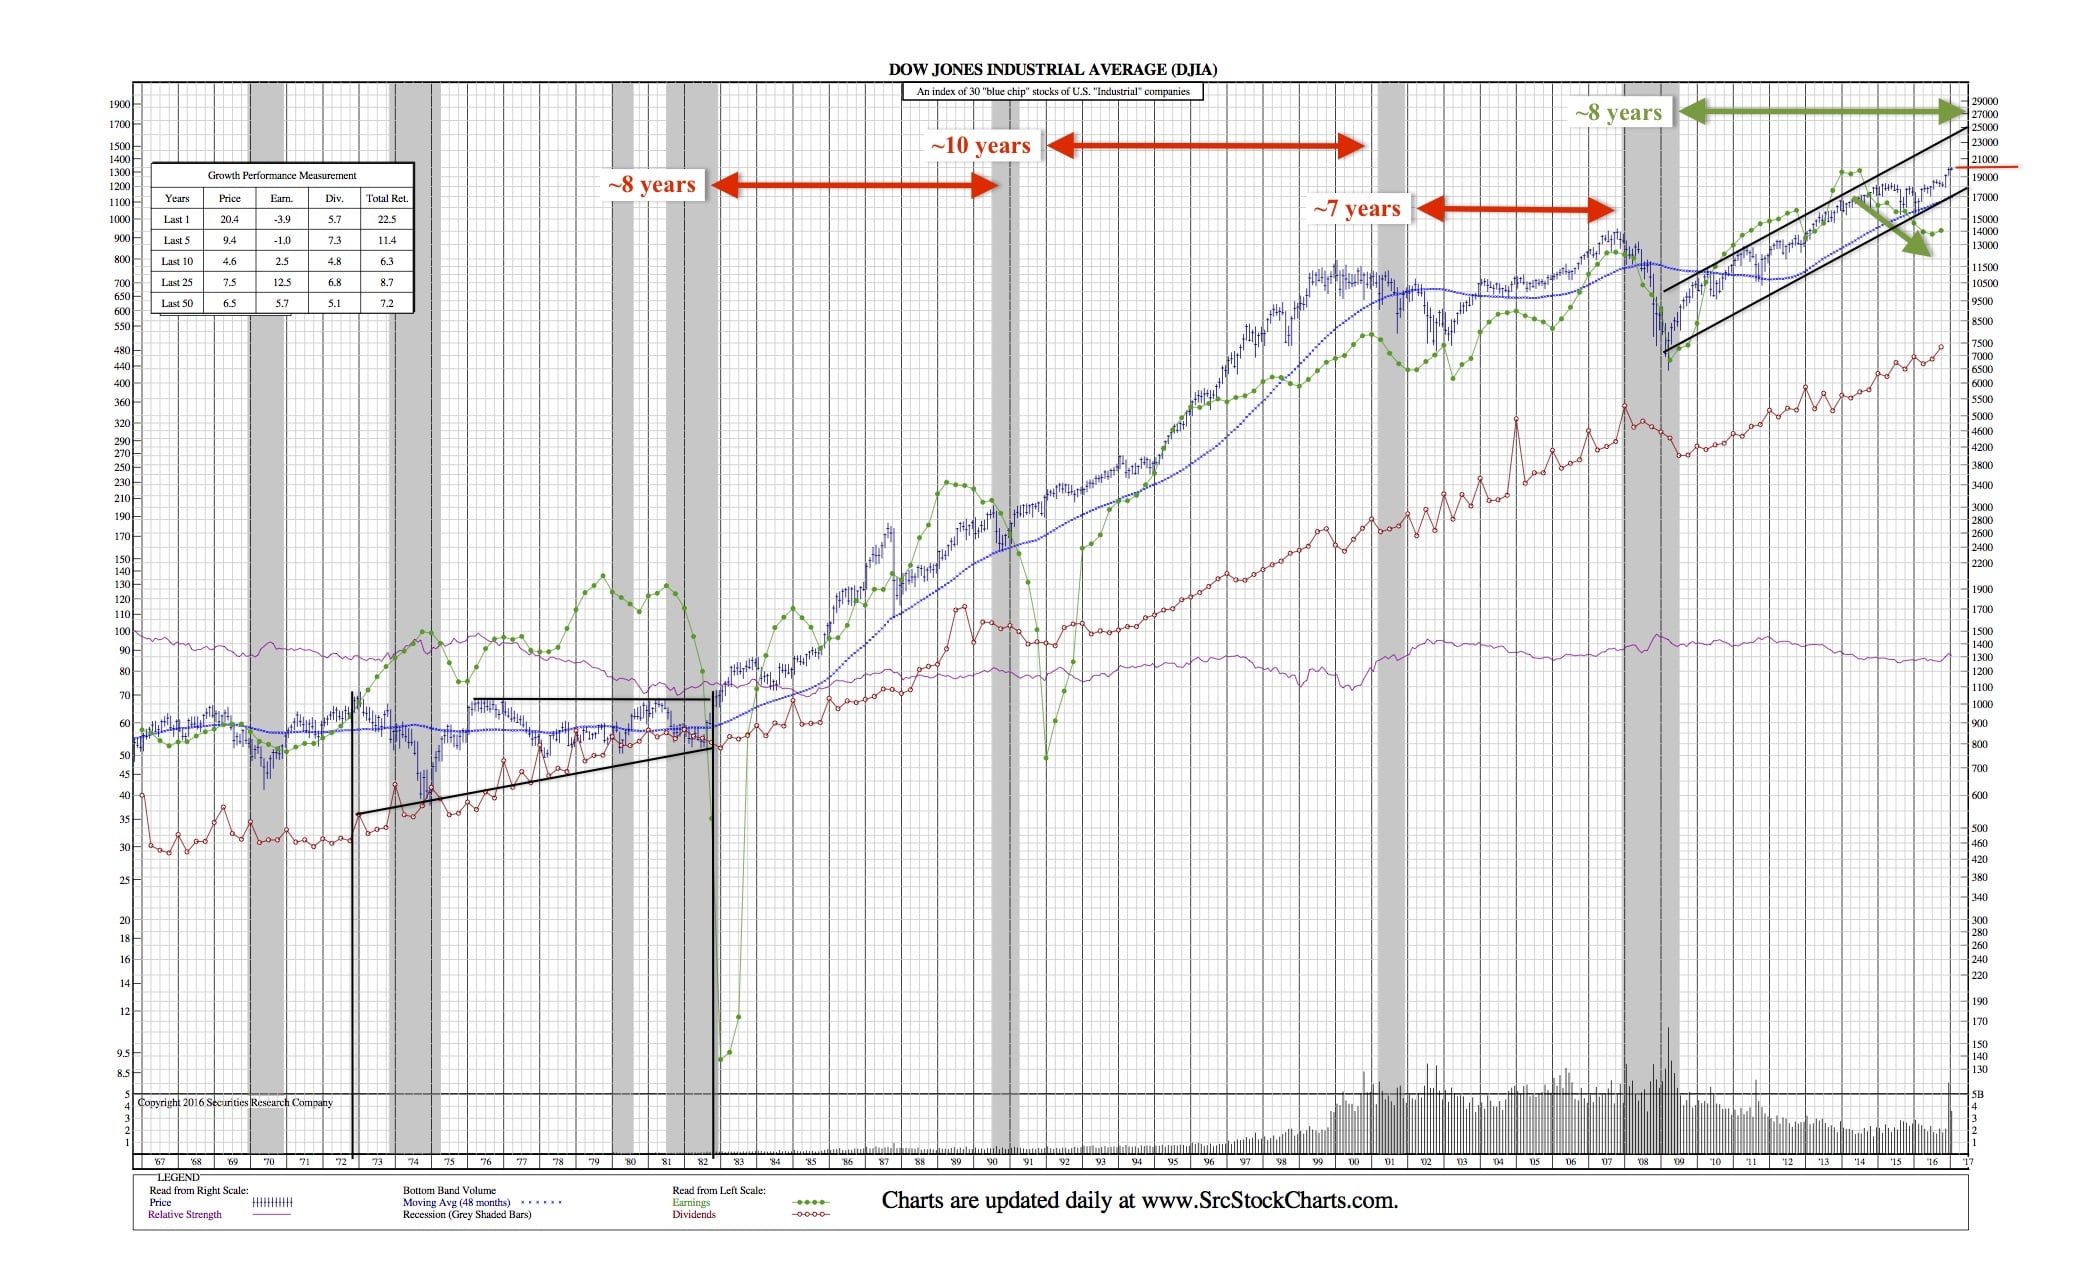
click to enlarge