Has Pfizer Hit a Bottom? (21-Month Chart Included)
Photo: WSJ
Article: The Street
Shares of Pfizer ($PFE) have been tracing out a steady downtrend since the beginning of August. On the second day of the month, the pharma giant opened the session with a very damaging breakdown gap, just one day after reaching new 52-week highs.
This earnings-inspired drop was the initial spark to what has been a very deep selloff.
Now, nearly 10 weeks later, Pfizer may have finally reached a significant bottom.
Back on Aug. 1, Pfizer had stretched its powerful rally off the May low to just over 15%. This impressive rally leg received a powerful spark on May 3 from its first-quarter earnings report.
The second leg of this big move came immediately after the Brexit panic had run its course. At the very end of this phase, just one day ahead of its latest earning report, Pfizer appeared to be breaking out from a two-and-a-half week consolidation. The nasty breakdown that followed on Aug. 2 left behind an ominous spike high, one that would lead to a complete retracement of the May rally.
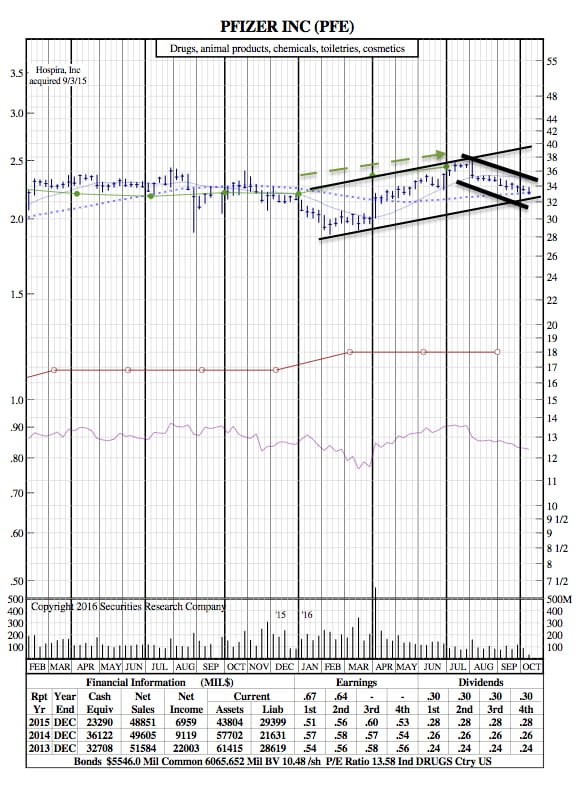
21-Month Chart:
As Pfizer returns to the $33 to $32.50 area, patient investors should keep a close eye on the action. This major support zone includes the stock’s 200-day moving average and May 3 breakout gap near the upper band. The lower layer shows the May low.
If Pfizer can regain its footing in this area, a solid bottom could begin to form. Once shares stabilize this support zone should be considered a very low-risk buying opportunity. On the downside, a close back below $32 would indicate a more prolonged basing process is ahead.